Improve
Updates for Rock 18.1
No updates made.Updates for Rock 1.0
No updates made.Updates for Rock 2.0
No updates made.Updates for Rock 3.0
No updates made.Updates for Rock 4.0
Below is a summary of the updates for this version.
- Documented the Page Title Lava feature on the Dynamic Data block.
- Added chapter on the new Dynamic Report block... yum!
Updates for Rock 5.0
Below is a summary of the updates for this version.
- Documented new settings on the Dynamic Data block.
Updates for Rock 6.0
Below is a summary of the updates for this version.
- Documented the new flexible series partition features.
- Added information on the new service metric entry block.
Updates for Rock 7.0
Below is a summary of the updates for this version.
- Added Lava as a metrics data source type and provided examples of how organizations might utilize it in reporting.
- Added new post-filter transformation options.
- Added Business Intelligence chapter.
- Added information about filtration control for multiple data views.
- Updated Edit Metrics screenshot and bullet points.
- Updated Dynamic Data Block screenshot and callouts with Encrypted Fields info.
Updates for Rock 8.0
Below is a summary of the updates for this version.
- Updated Dynamic Data Block screenshot and callouts with Encrypted Fields info.
- Added Age Classifications section to Filtering Using Data Views chapter.
- Updated Post-Filter Transformations to include Family Members.
- Documented new options on Dynamic Report block
Updates for Rock 9.0
No updates made.Updates for Rock 10.0
Below is a summary of the updates for this version.
- Added Page Parameter Filter block
Updates for Rock 11.0
Below is a summary of the updates for this version.
- Added ability to view performance and frequency information for Data Views
- Data Views that apply to Person records have an "Include Deceased" option
Updates for Rock 12.0
Below is a summary of the updates for this version.
- Updated the Report Detail block to show time to
run and run count similar to the Data View Detail
block
- Data View Results is now its own block, which introduces an option to launch a workflow from a Data View Results grid
- The Dynamic Data block has a new setting to allow for automatic inclusion of a panel
- Data Views that return people can be partitioned by Campus in Metrics
- The Service Metric Entry block now has additional filtering block settings
Updates for Rock 13.0
Below is a summary of the updates for this version.
- The Page Parameter Filter block has a setting to allow for no update, block update, or page updates when filters are updated
- The Calculate Metrics job has a new Command Timeout setting that lets you control how long the process will run before timing out when calculating SQL-based metrics
- Data Views have new "Head of Household" and "Giving Leader" Post-filter Transformations
Updates for Rock 14.0
Below is a summary of the updates for this version.
- Metrics can now be calculated on demand using the new Run Now feature
- A new Unit Type setting lets you indicate if your metric is tracking numbers, currency or percentages
Updates for Rock 15.0
Below is a summary of the updates for this version.
- Data Views can be persisted at regular intervals or on a schedule
Updates for Rock 16.0
Below is a summary of the updates for this version.
- Post-filter Transformation options include "Allowed Check-In" and "Allowed Check-In Children"
Updates for Rock 17.0
Below is a summary of the updates for this version.
-
Dynamic Data blocks let you craft the display of filtered data, providing flexible reporting
- Implemented caching logic in Data Views to improve performance
-
Measurement Classifications define metric purposes, enabling Rock
to interpret their data
Welcome
There's no use putting data into a system if you can't get it back out. In fact, the tools
to report and display your data are much more important than the entry tools. Rock's
reporting and analytics tools were some of the first features to hit the drawing board.
We based them on years of real-world experiences – previous successes and lessons learned.
We hope that you'll take the time to not only learn how to drive the tools, but more
importantly, how to build a successful reporting strategy that provides consistent and
reliable results.
Let's get started.
If You're Only Going to Read One Chapter
OK, now that we have your attention... Before diving into the tools let's start with a
discussion on strategy. It's tempting to want to start writing your first report. But
trust us - this chapter will save you countless hours and the embarrassment that comes
from delivering conflicting and incorrect reports.
The usual workflow for application reporting goes something like this:
-
Get a request for a report.
-
Write the report per the request.
Seems pretty logical, right? This is actually a great strategy if you only get one report
for the lifecycle of the application. Well, that's never going to happen! We all know
you'll need to write hundreds of reports over the lifetime of the application. The problem
is that many of these reports will have lots of similar requirements, with just small
differences. Eventually, you'll end up wasting a good amount of time writing almost the
same reports. If you're not careful, some of them might even conflict with each other. So
why not slow down and create a strategy of re-usable reporting components? Ok, that
sounds like a plan!
When designing Rock, we resisted the urge to rush and make a traditional ad-hoc reporting
tool. We looked back at the years of lessons learned (embarrassingly enough there are many
of them) and designed an architecture that allows you to build a reporting strategy.
What Makes Up a Report?
There are two facets to any report: filter and display criteria. Consider this example.
Your organization's leader walks in your door and asks for a list of attendees over
the age of 18 who began attending within the last two years. They would like to have
the names, contact information and the number of times they have attended. Using
this example, let's look at each of the facets of reporting.
-
Filter Criteria: These are the criteria that limit the results to
display. They answer the "Who" part of the request. In the case of the example,
the criteria would be:
-
Attendees
-
Greater than 18 years of age
-
Began attending in the last two years
-
Display Criteria: Once the results are filtered you must display
them, with the necessary attributes, to the person using the report. In the case
of our example, these attributes might be:
-
Name
-
Phone
-
Email
-
Address
-
Number of Times Attended
Once you create your handy report for your leader, it's very likely they'll be back
asking for further changes. Perhaps now they want another report with the same logic
but only showing females. In most systems you'll have to start over and make a copy
with the addition of the new criteria. Now you have two very similar reports to
maintain.
With Rock, we have deliberately chosen to split the filter and display activities in
reporting. You create your filters by defining
Data Views. You then
create your display by creating Reports
that use the Data Views.
Reporting Strategy
The strategy part of reporting comes from the definition of your Data Views.
It will be tempting to quick-write a very specific data view for each report.
Consider, though, that data views can extend and build off of each other. For
instance, you might create a data view that filters
Adult Members & Attendees
and then create a new data view that uses this view and adds the criteria of female
gender. You’ve now created two views that can be used for the report at-hand AND in
future reports. What’s more, if you ever need to redefine what makes an
Adult Member & Attendee,
you can change it in one place and all reports that are built off of that view will
get the new definition. These two data views are available out-of-the-box with Rock.
Consider the results of these views on the Rock sample data in the figure below.
Sample Data View
Before starting any report, you should ask yourself:
-
What, if any, criteria filter in this report might be reusable in future reports?
-
What data views have I already defined that I can start with for this report?
Warning
You can take the concept of reusable data views too far. Be sure to strike a
balance between what is reusable and being overly complex.
Don't worry - we've only scratched the surface of Rock's tools. Now let's get our
hands dirty learning about creating data views and reports as well as learning about
Rock's other reporting tools.
Filtering Using Data Views
The bulk of your reporting will happen in Data Views. Data Views are a way to select and
filter records based on any field in the system. And by any, we mean any! For the most
part, you'll be creating views that display individuals and sometimes groups. Data Views
are not limited to just these two entities though. You can write a Data View for any type
of data in Rock including financial transactions (aka giving), metrics, page views,
etc.
Let's start by looking at a couple of the Data Views that come out-of-the-box. Data
Views are configured under Tools > Data Views.
Below is a figure of the default list of data views. Over time you'll collect plenty of
data views. To help you organize them we allow you to create a hierarchical directory of
categories. The use of categories again becomes a part of your reporting strategy. What
good is a reusable data view if you can't find it when you need it?
Anatomy of a Data View
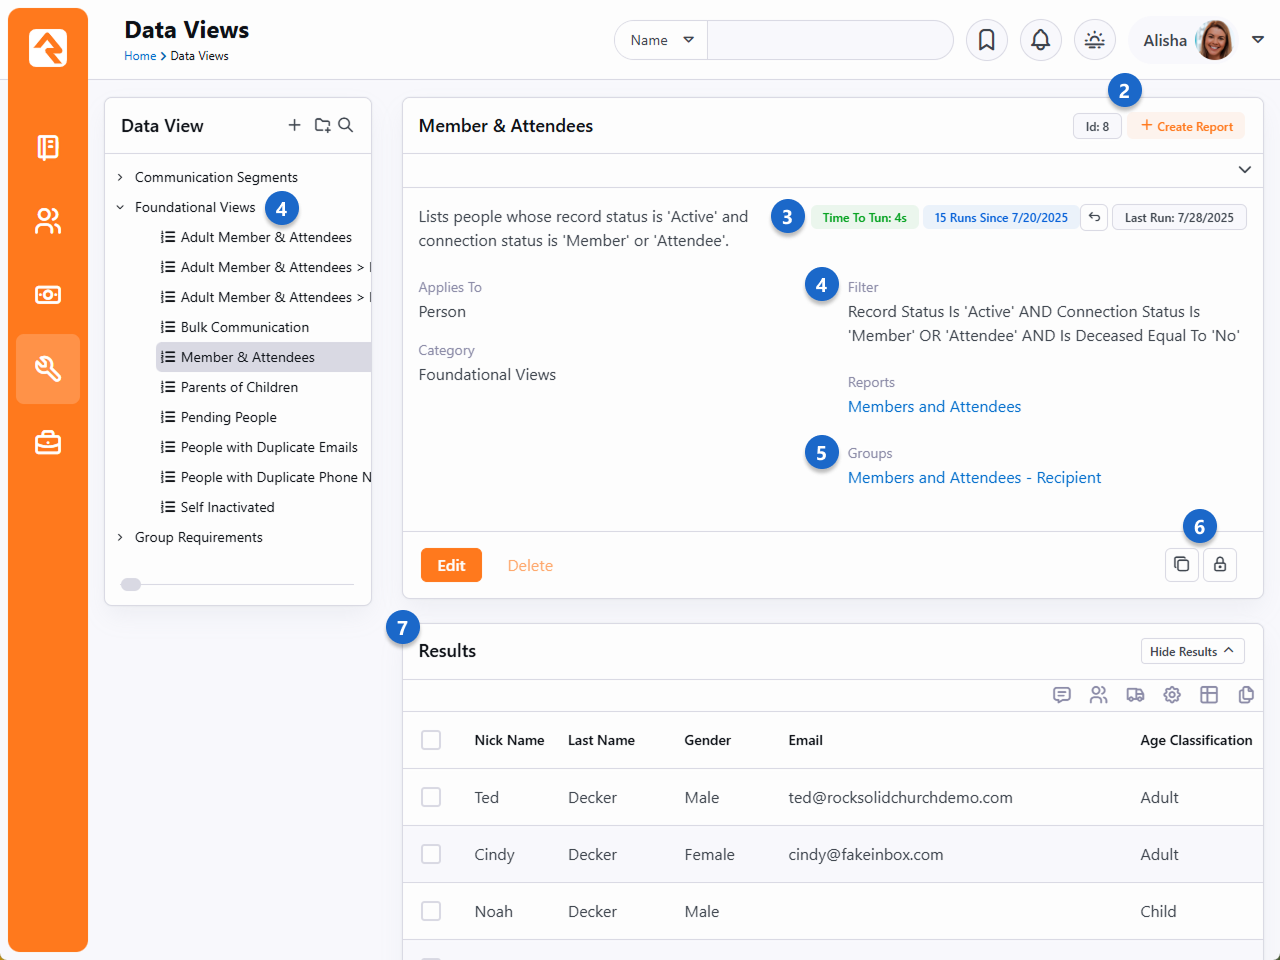
- 1 Categories
- Data views are organized into hierarchical categories. Categories help you sort and organize
your data views.
- 2 Id and Create Report
- The Id of the data view is displayed here for reference. You can also click the
Create Report button
to start creating a report using the data view. We'll explain creating reports in the next
chapter below.
- 3 Run Details
- How this area looks will change depending on the activity, or lack of activity,
associated with a data view. In this example we can see:
- Time to Run - This label shows how long it took to retrieve the
data. This is a great way to identify potential performance issues.
- Runs Since - Here you can see how many times the data view has been
run since the displayed date. This is an easy way to get a sense of how frequently the
data view is used.
- Reset - Click the
button to reset the Runs Since
field. This will set the count of runs back to zero, as of today's date.
- Last Run - This displays the most recent date that the data
view was run. If the date is very far in the past, you might examine if the data view
is needed anymore. Removing unused data views may help system performance but will
also ensure a tidy system in general.
- 4 Data View Filter Summary
- This is an automatically generated summary of the filters used in this data view. We'll talk
more about these filters below.
- 5 Data Views / Reports
- In this area you can easily see which other data views, reports or
group syncs
are using this data view. If you make any changes to the data view, these items will be
impacted.
- 6 Copy / Security
- The icon
will create a new data view that is a copy of this one. You can also click the
icon to change
security permissions for this data view.
- 7 Results
- These are the actual results of your data view configuration, according to the filters you've added.
We'll go over filters in more detail below. Note that the results are in their own block, so you can
do things like launch workflows for the items listed.
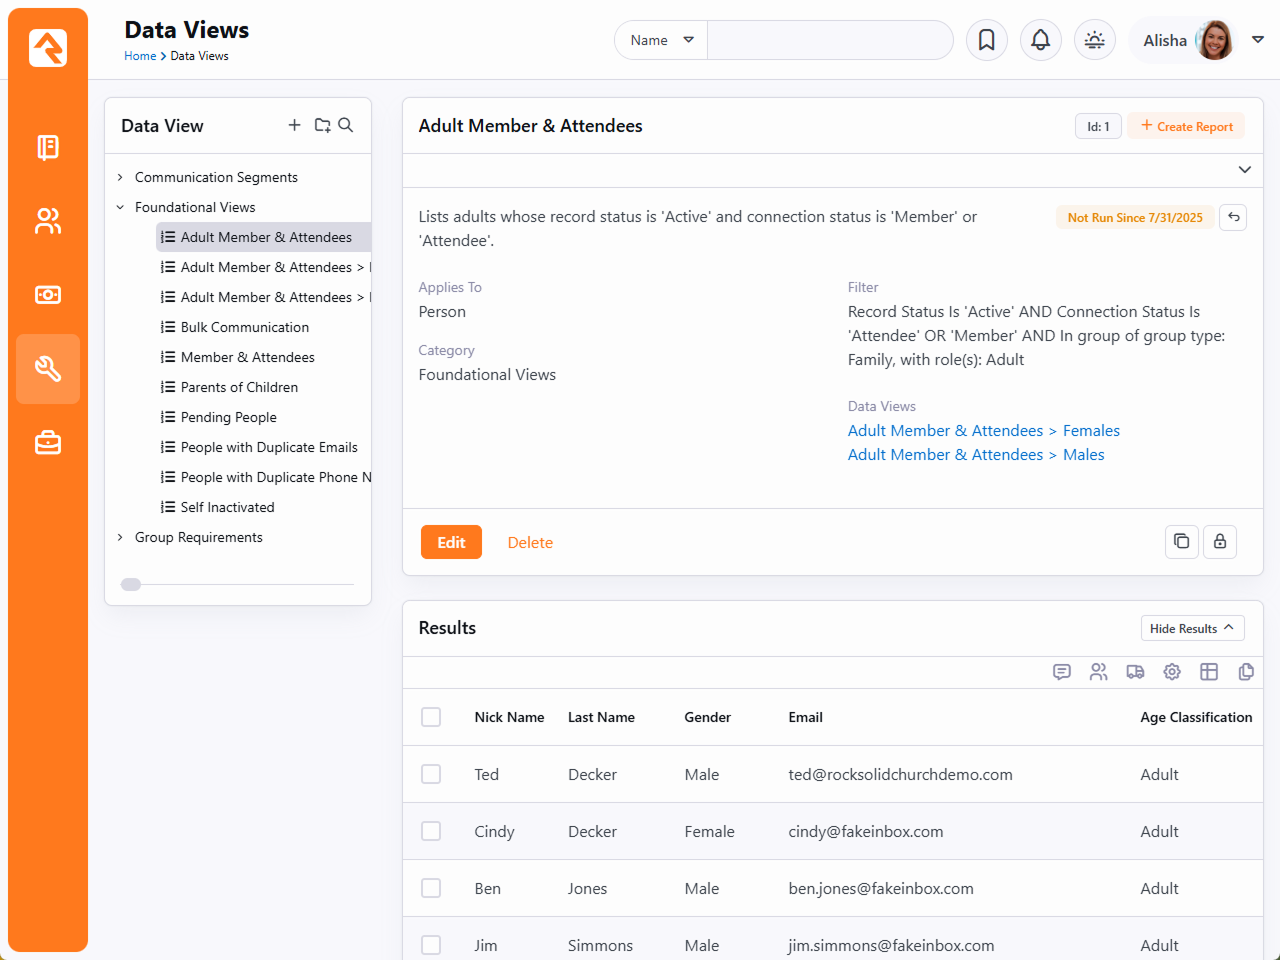
Now let's drill into the first data view called
Adult Members & Attendees.
As you probably guessed, this view filters adults who have the connection status of
Member
or Attendee.
It also only returns only active records. Click the Edit
button to see how this data view is configured.
Editing a Data View
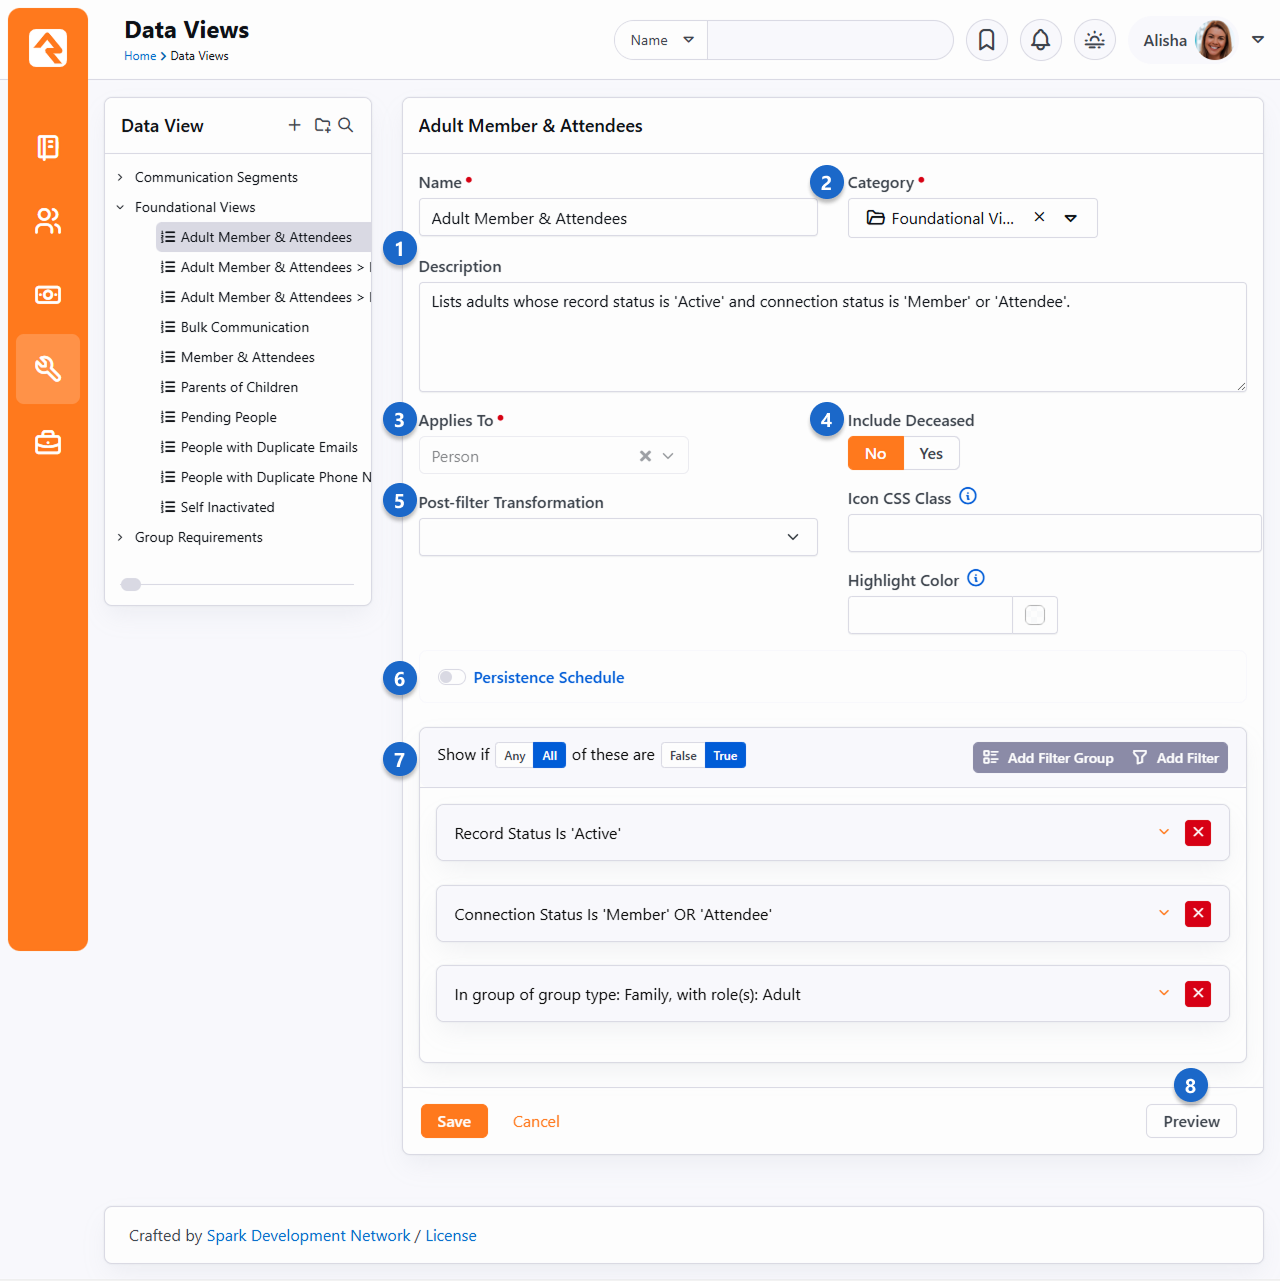
- 1 Name / Description
- The name and description of the data view. We highly recommend writing a detailed
description for your data view. Be sure to include how you intend the data view to be used.
These details may not seem important now, but your future self will be thanking you.
- 2 Category
- A category should already be assigned when you first create the data view, but you can change
it here if needed.
- 3 Applies To
- Technically, this field is where you specify the
entity the data view is
referencing. This tells Rock what filter options you have, which we'll discuss below. Most of the
time you'll probably use either 'Person' or 'Group', but you're not limited to those.
- 4 Include Deceased
- This field will appear for data views that apply to people. If this is enabled, people who are
marked as deceased in Rock will be included in the data view's results. In most cases this will
be disabled.
- 5 Post-filter Transformation
- This is where you can optionally select one of the following
post-filter transformations:
- Allowed Check-In
- Allowed Check-In Children
- Children
- Family Members
- Father
- Giving Leader
- Grandchild
- Grandparent
- Head of Household
- Mother
- Parents
- Spouse
For more details see the Post-Filter Transformations
section below.
- 6 Speed Settings
- Here you can choose to set a
Persistence Schedule.
To learn more about these settings, see the
Persisting Data Views section below.
- 7 Filters
- This is where you create the filters that are used to define your criteria for
limiting records. We'll dive into how the filter area is used in later sections below.
- 8 Preview
- To help check your work you can select the Preview button.
This will show only the first 15 rows of data returned by your filters.
Next, let's look at the Adult Members & Attendees > Females
Data View. Initially you might expect to see a lot of the same criteria as the previous
Adult Members & Attendees
data view, with the addition of the female gender filter. Clicking the Edit
button, you’ll see the data view strategy at work.
Female Members and Attendees
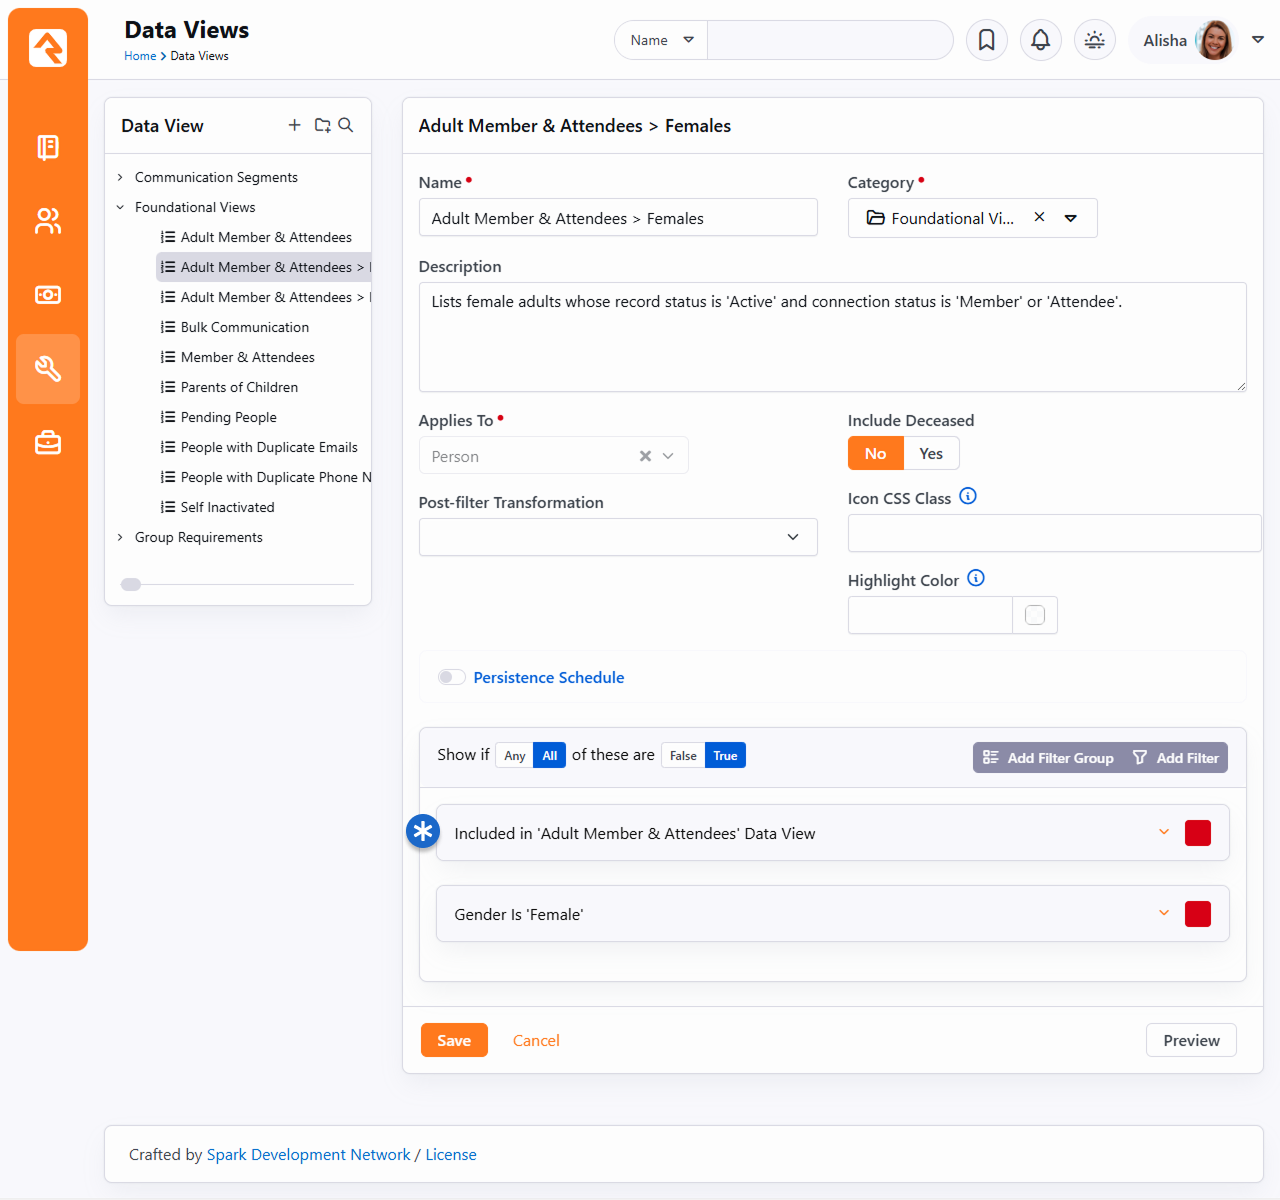
Notice how the first criterion is
Included in Data View: Adult Members & Attendees?
That says, "Take all of the filter criteria from the
Adult Members & Attendees
data view and apply it here." Since that logic was already built, all we needed to do
here was add the gender filter.
Now, let's say in the future you'd like to enhance the definition of
Adult Members & Attendees
by ensuring that the age of the individual is over 18. You can add this to the base view,
and it will dynamically apply to all subsequent views that use it.
Age Classifications
Speaking of the ages of individuals...Rock allows for simple and quick filtering on whether
an individual is an Adult or a Child using the Age Classification property. This property is
available as a Person filter type when creating Data Views and as a Field Type when creating
Reports (more on that in the next chapter). In Rock, an adult is anyone over the age of 18 or
marked as an adult in one or more families. A child is anyone less than 18 or a child in all
families. If neither of these conditions are met, the individual is marked as Unknown. Rock
calculates age each time a person is saved and re-calculates it every time the Rock Cleanup
job is run.
Any vs All
At the top of the filter group, you’ll notice a setting that says
Show if Any/All of these are true.
You might be wondering what’s the difference between Any
and All. Let’s define each:
-
All: This means that each of the filter criteria must be true in
order for a record to be displayed. One helpful trick is to read through each
filter and insert the word and
in between each. So, for a record to display in the Adult Members & Attendee
view, a record must: have a record status of active AND a connection status of
member or attendee AND must be an adult in a family.
-
Any: This setting means that if
Any
of the filter criteria is true then display the record. It's like inserting the
word OR between each criterion.
If You Forget
If you forget the difference, read the
Filter
summary on the data view detail view. It writes out the criteria inserting
AND
or OR for you.
Filter Groups
For complex views you may need to include both
AND
and OR type logic
into your view. Filter groups give you this option. Say for instance you need to
create a view that shows individuals who are married AND a member OR who are single
AND an attendee. That data view would be configured like this:
Filter Groups
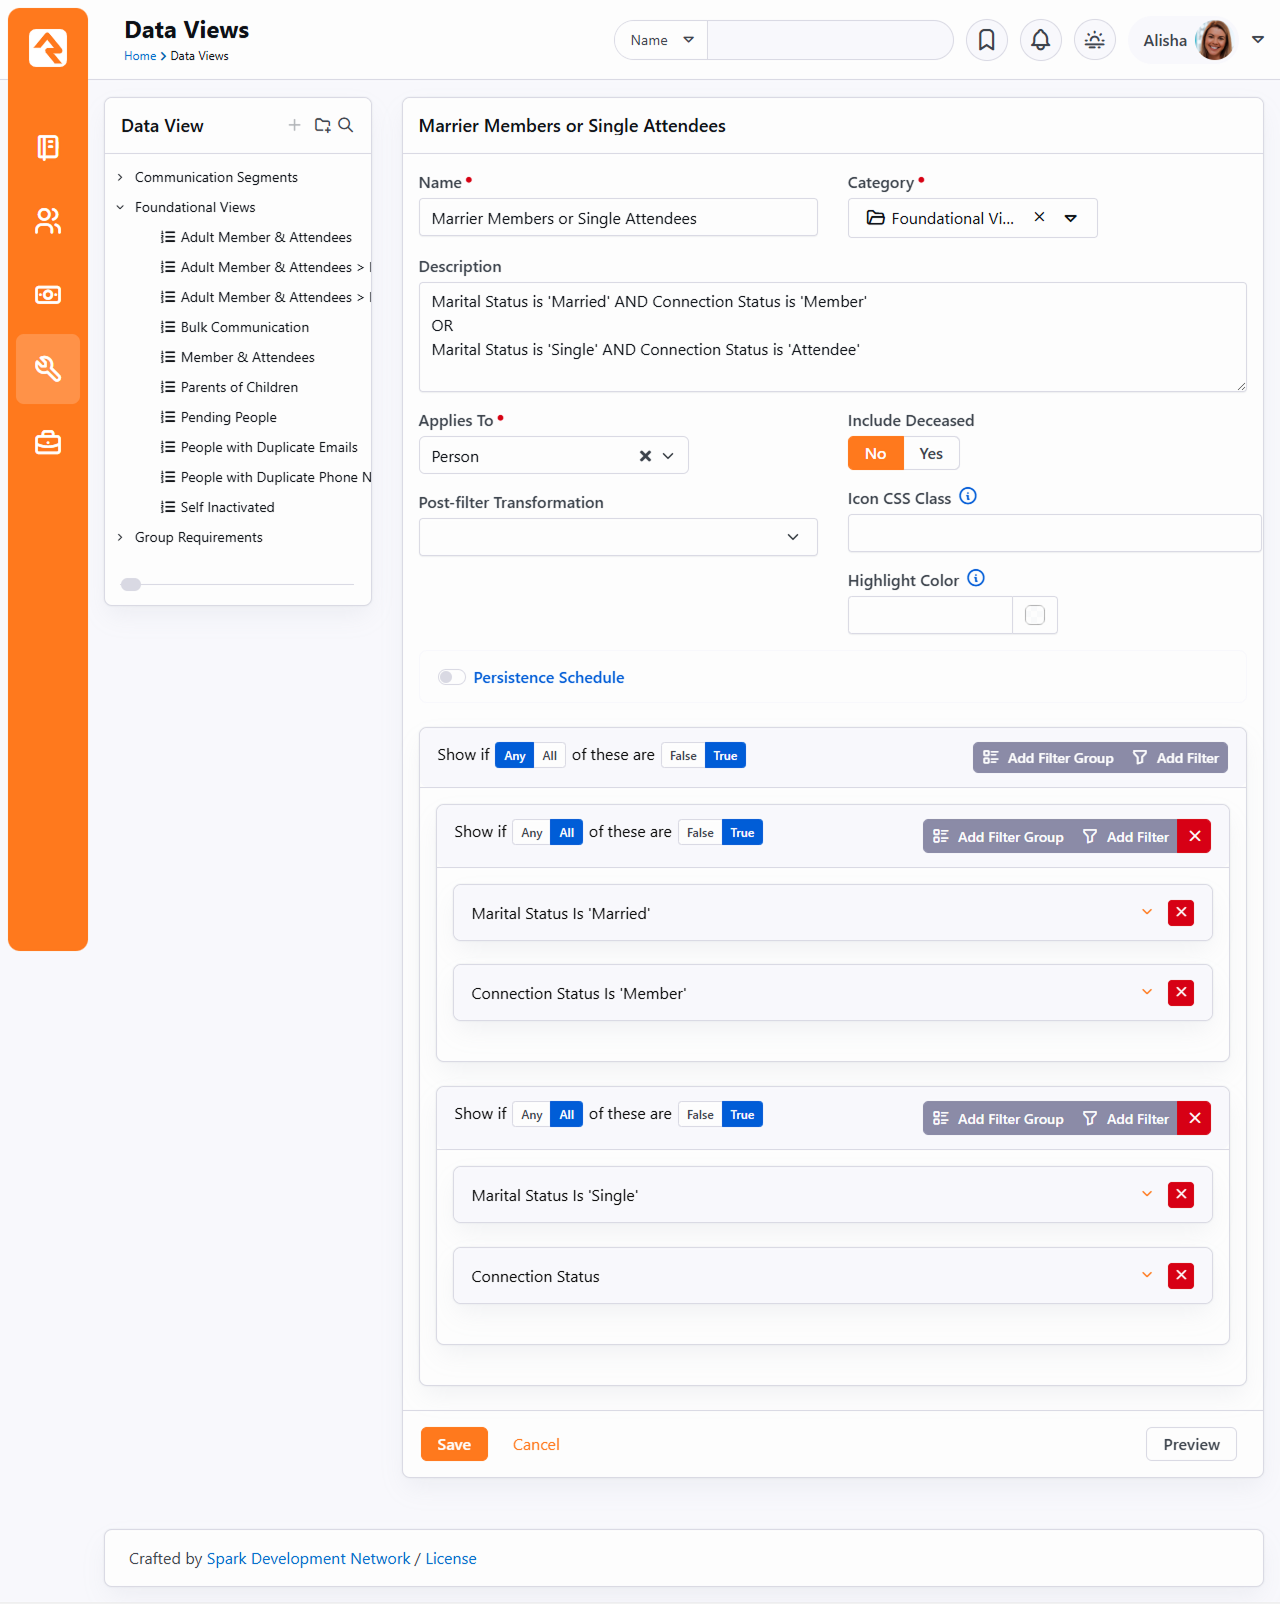
Note how we have two filter groups where if
Any
of them is true the record is selected. They in turn have criteria that must
All match.
Post-Filter Transformations
The Post-Filter Transformation gives you the option to "flip" the results of a Data View
with ease. For example, if your Data View includes the kids attending summer camp,
selecting the Parent
transformation will find the parents of those kids. If your Data View includes
Adult Members & Attendees,
choosing the Children
transformation will give you the children of those selected. To provide as much flexibility as possible,
Rock allows you to transform data views by applying the following transformations:
- Allowed Check-In
- Allowed Check-In Children
- Children
- Family Members
- Father
- Giving Leader
- Grandchild
- Grandparent
- Head of Household
- Mother
- Parents
- Spouse
Securing Data Views
There will be Data Views that you want to limit access to. Note that you can control
who has access to Data Views. To change the default security on a Data View, click the
button on the data view details screen.
You can also check the access for Data View categories. This allows you to modify the
security for all Data Views in that category.
Taking Security Further
Controlling who has access to Data Views is important. But you also need to limit who
can make new Data Views with certain criteria. You can limit what filters are
available to specific people and groups under
Admin Tools > Settings > Data Filters.
Here you'll see a list of available filters with the ability to change who has access
to use each filter.
When filtering on the attributes of an entity (like person attributes), normal
attribute security will be used in controlling access.
You can also control security on the Data View transforms. This can be configured
under
Admin Tools > Settings > Data Transformations.
Let's Go Farther
You can create your own post filter transforms and custom filters. Doing this
does take some programming knowledge, but it's possible. See our
developer docs
for more information.
Persisting Data Views
Sometimes when you have an extremely large or complex Data View, it can take a long time for
Rock to filter down to just the records you're interested in. This can be critical when you're
relying on the information in the data view for reports, for workflow actions (using
Lava) and just to keep the
load on your server as low as possible. This is especially true when you have data views
referencing several other data views.
Persisted Data Views to the rescue! If Persistence is enabled, Rock will only calculate the records in the list
as frequently as you specify. That means that when you click on the data view, Rock already
knows what records are in the list and can provide them extremely quickly. (Calculating the
contents of persisted data views is what the
Update Persisted Dataviews
job does, in case you were wondering).
When you persist a Data View, keep in mind that the statistical data (Time to Run, Runs Since,
and Last Run) may not update as frequently as you'd expect. These values usually change only
when the Data View's results are updated, not when the persisted results are being used. In other
words, retrieving data from a persisted Data View doesn’t require it to be re-run, so the run
statistics aren't always updated. Most of the time, the Data View will only be truly re-run when the
job recalculates its contents, and that’s when you can generally expect the statistics to
change.
Since Rock isn't calculating the contents of these Data Views every time you load it, that does
mean that the list might be out of date by up to the interval you specify. For instance, let's
say that you have a very involved data view that, among other requirements, requires that the
people in it are members of a certain group. But it's such an involved data view that it takes
quite some time to load, so you set a Persistence Interval of "2 Hours". If Ted Decker
matches all of the filters, then he will show up in the Data View when it's calculated, as
expected (along with anyone else who matches all the filters). Now, if Ted leaves the group that
you have to be a member of to be included in that Data View, it's possible that he will continue
showing up in that Data View for up to two hours; the next time that persisted Data View will be
re-evaluated.
Usually, it's not extremely important that your Data Views be absolutely accurate up to the
second, so that might not be a big deal. But if you're relying on a data view for something that
needs to truly reflect the absolute latest data, then you should leave the
Enable Persistence
setting disabled.
Nested Persisted Data Views
Now, let's look deeper at nested Data Views and how it works when they're persisted. Let's say
that we make "Adult Member & Attendees" a Persisted Data View - it's going to be calculated
every two hours. Let's also say that we have another Data View that has a filter that specifies
that the people must also be in the "Adult Member & Attendees" Data View. (Usually, you'd have
other filters as well, naturally). It would look something like this:
Nested Data Views
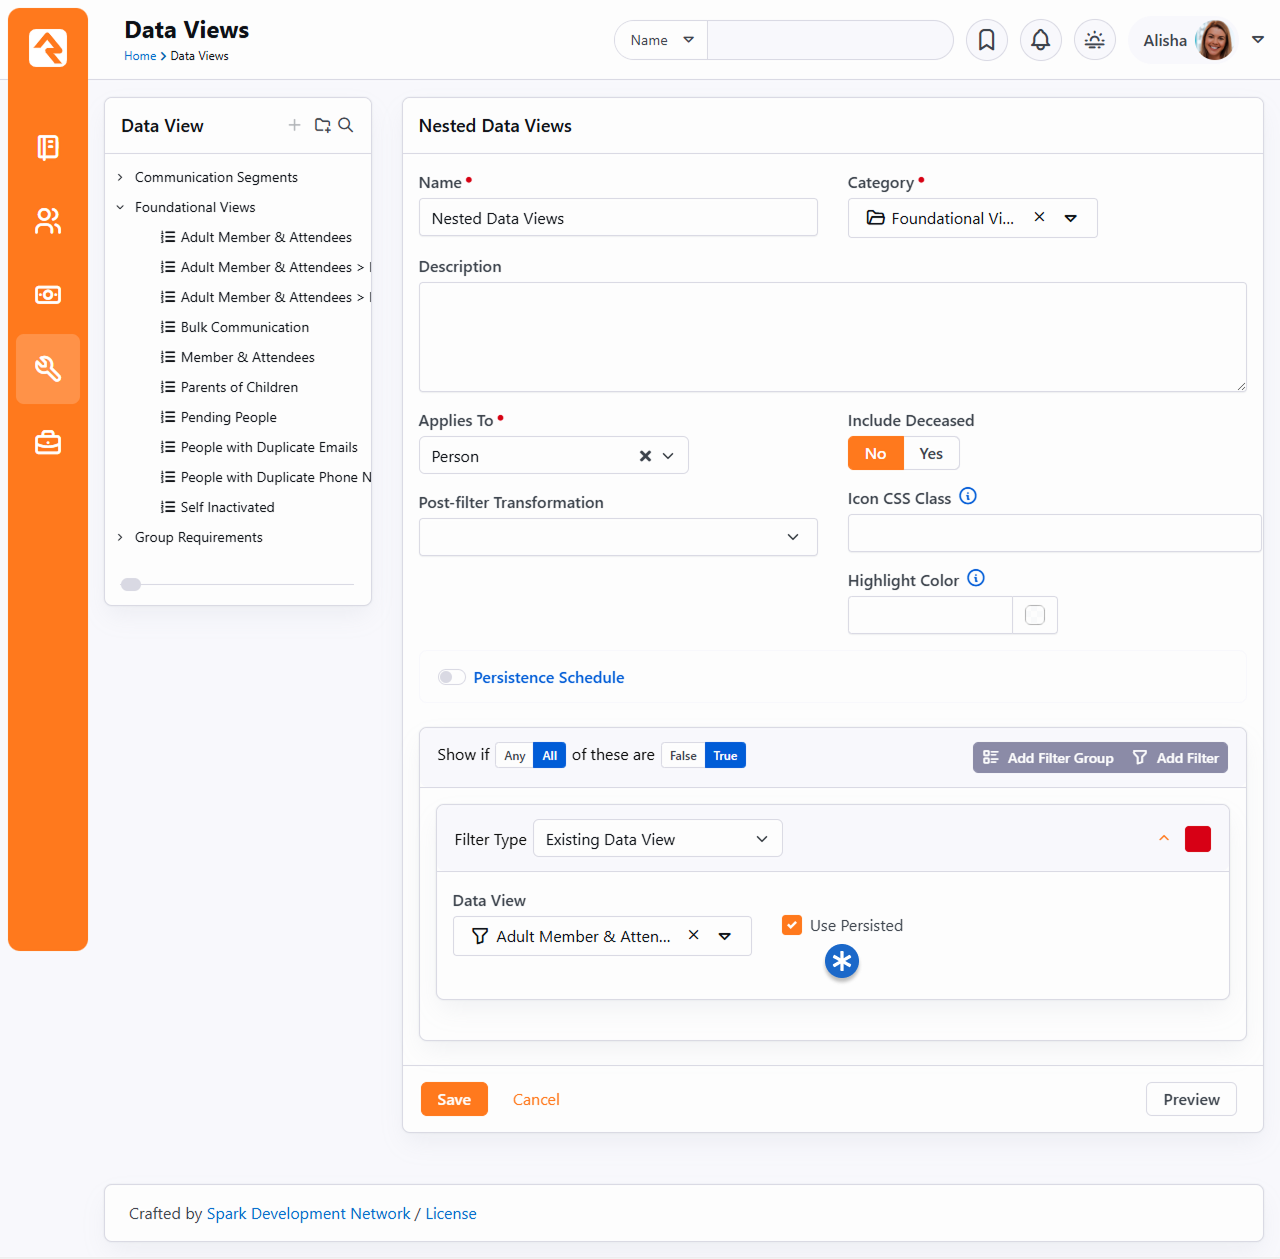
Since "Adult Member & Attendees" is now persisted and only calculated every two hours, then
whenever you load a Data View that references it (with "Use Persisted" selected as shown) the
list of Adult Members and Attendees might be as much as two hours old. Hopefully nobody stopped
being a member/attendee that quickly, but if they did, they could continue showing up in this
Data View until the next time the nested Data View is calculated.
Put another way: if a Data View has persisted child data views, it will use the persisted
version of the child data view if "Use Persisted" is enabled.
In general, it would be much faster to persist a data view if "Use Persisted" is enabled on its
child data views. However, its accuracy is limited to the child data view that had the
longest "Persistence Interval".
Displaying Data Using Reports
Now that we've selected the records we need, we're ready to define how we want our report
to display. Usually this means adding fields to our report. Let’s see how this is done.
Reuse Is Good
Separating the filtering from the display also has the added benefit that reports with
separate display features can use the same filtering logic. In many systems you would
have to redefine the same filters twice. This is a lot of extra work, and it's a
nightmare to keep consistent over time.
You define your reports under Tools > Reports.
Like their Data View cousins,
reports are also organized using hierarchical categories.
Report Details
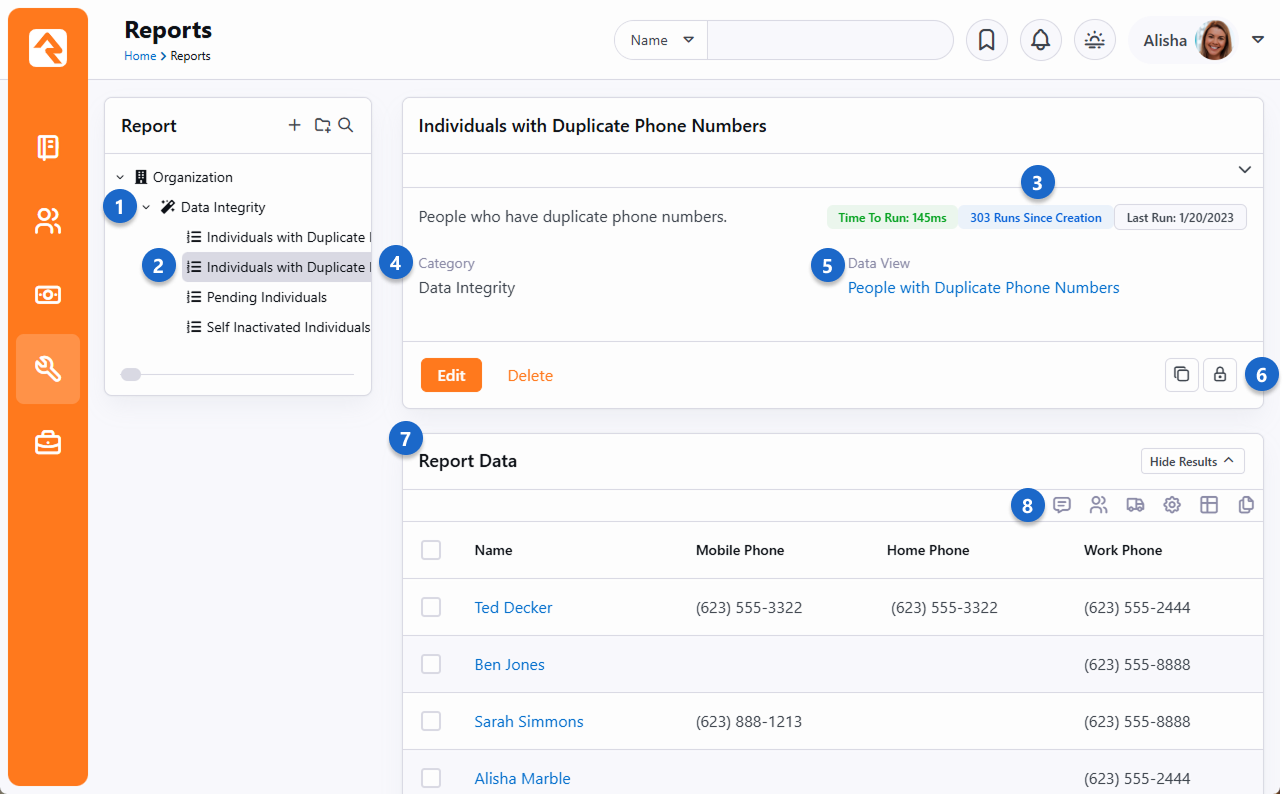
- 1 Categories
- Reports are organized into hierarchical categories.
- 2 Report List
- List of reports for the selected category.
- 3 Report Metrics
- At a glance you can see how long the report takes to run, how many times it
has been run and the date on which it was last run. This information is great
for ensuring the report is performant and is actually being used.
- 4 Report Details
- The details for the selected report.
- 5 Data View
- A link to the data view that drives this report.
- 6 Security
- Reports can be secured to limit who can view them.
- 7 Results
- The report results.
- 8 Grid Actions
- The data from reports can be used to send communications, export to Excel, or other actions
appropriate to the entity they refer to.
Creating A Report
Let's jump right in and take a look at a report. For our example, we'll look at
a report that gives the name and phone numbers of individuals with duplicate phone numbers.
The figure below shows what this report would look like. The callouts for the figure
explain the various steps used in the creation of our report.
Editing a Report
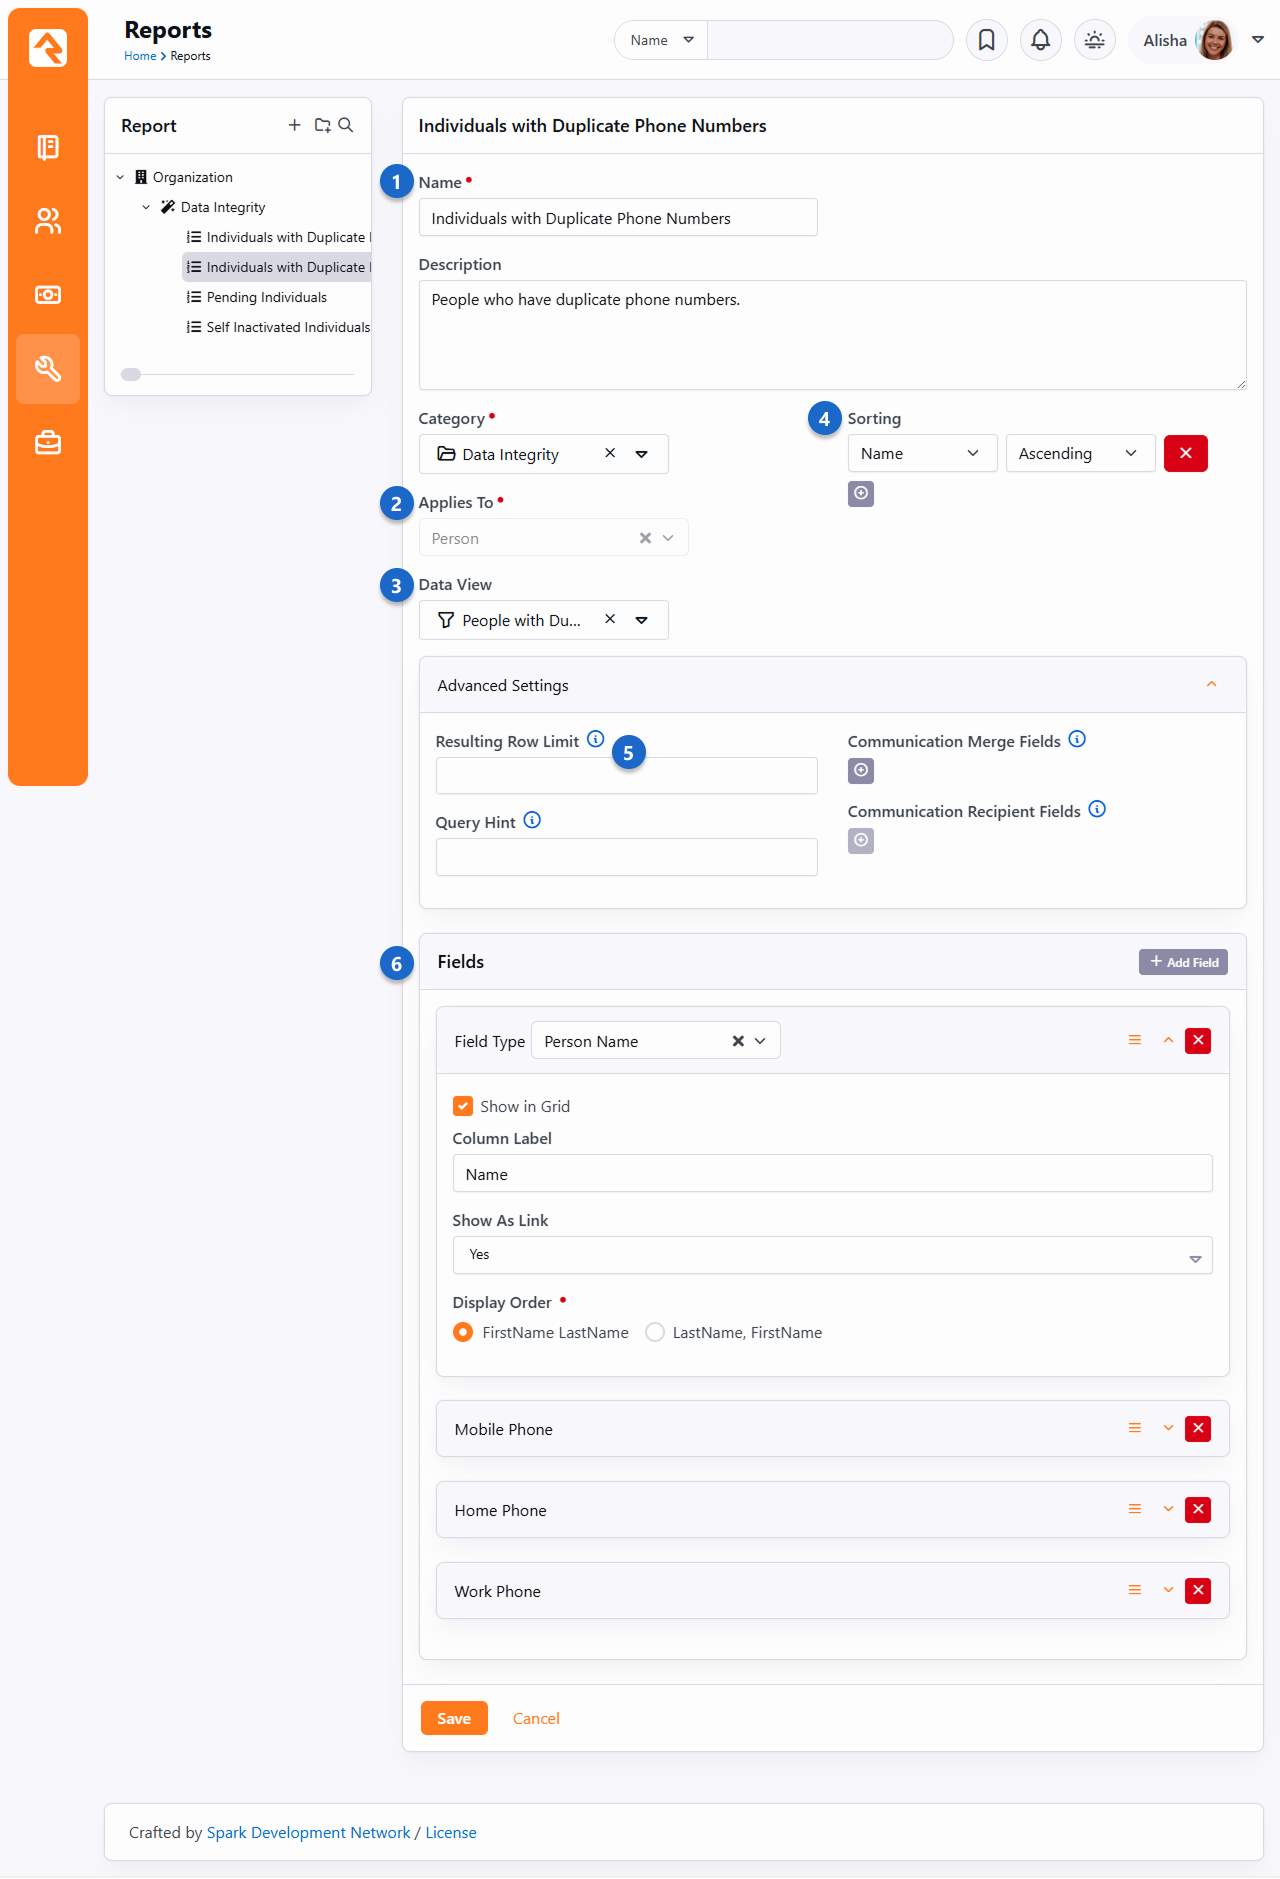
- 1 Name / Description
- First, we give our report a name and description. We highly recommend that you
spend some time writing a clear description that tells what the report does and
how it should be used.
- 2 Applies To
- Next, select what type of entity you are writing a report for. In most cases this
will be Person
but, like Data Views, you can report on anything.
- 3 Data View
- Now that you have selected the entity, you'll see a list of
Data Views
you can use as the source for your report.
- 4 Sorting
- You can sort your report by any field you add in either ascending or descending order. You
can even choose to sort on more than one field at a time.
- 5 Resulting Row Limit
- If needed, you can limit the number of records that are displayed on your report.
- 6 Fields
- Finally, you'll add the fields you want to display on your report. You can
determine for each field whether or not you want it to display in the grid. You
might be thinking, "If it's not on the grid where else would I see it?" If you
don't check this button, the field will still be available when you export the
report to Excel from the bottom of the grid. This is helpful for supporting
information that is not needed very often.
The Power of Lava
You'll notice that one of your field options is
Lava.
Lava is a templating engine that allows you to customize the way data is presented.
With this field type you can mix and match data in lots of different ways.
One Caveat
Every field you would like to use in your Lava must be included in your report.
For instance, if you want to use the First Visit
date in your Lava, you have to have that field in your report already. (You can
disable showing the field in the grid if you wish). You would access your First Visit column using a Lava Merge Field
of the name of the column you want to reference, eliminating any spaces. In this case, information in the "First Visit" column would be displayed using the Lava Merge Field
{{ FirstVisit }}. Also, you can't reference
one Lava column's value from another Lava column.
Below are a few examples:
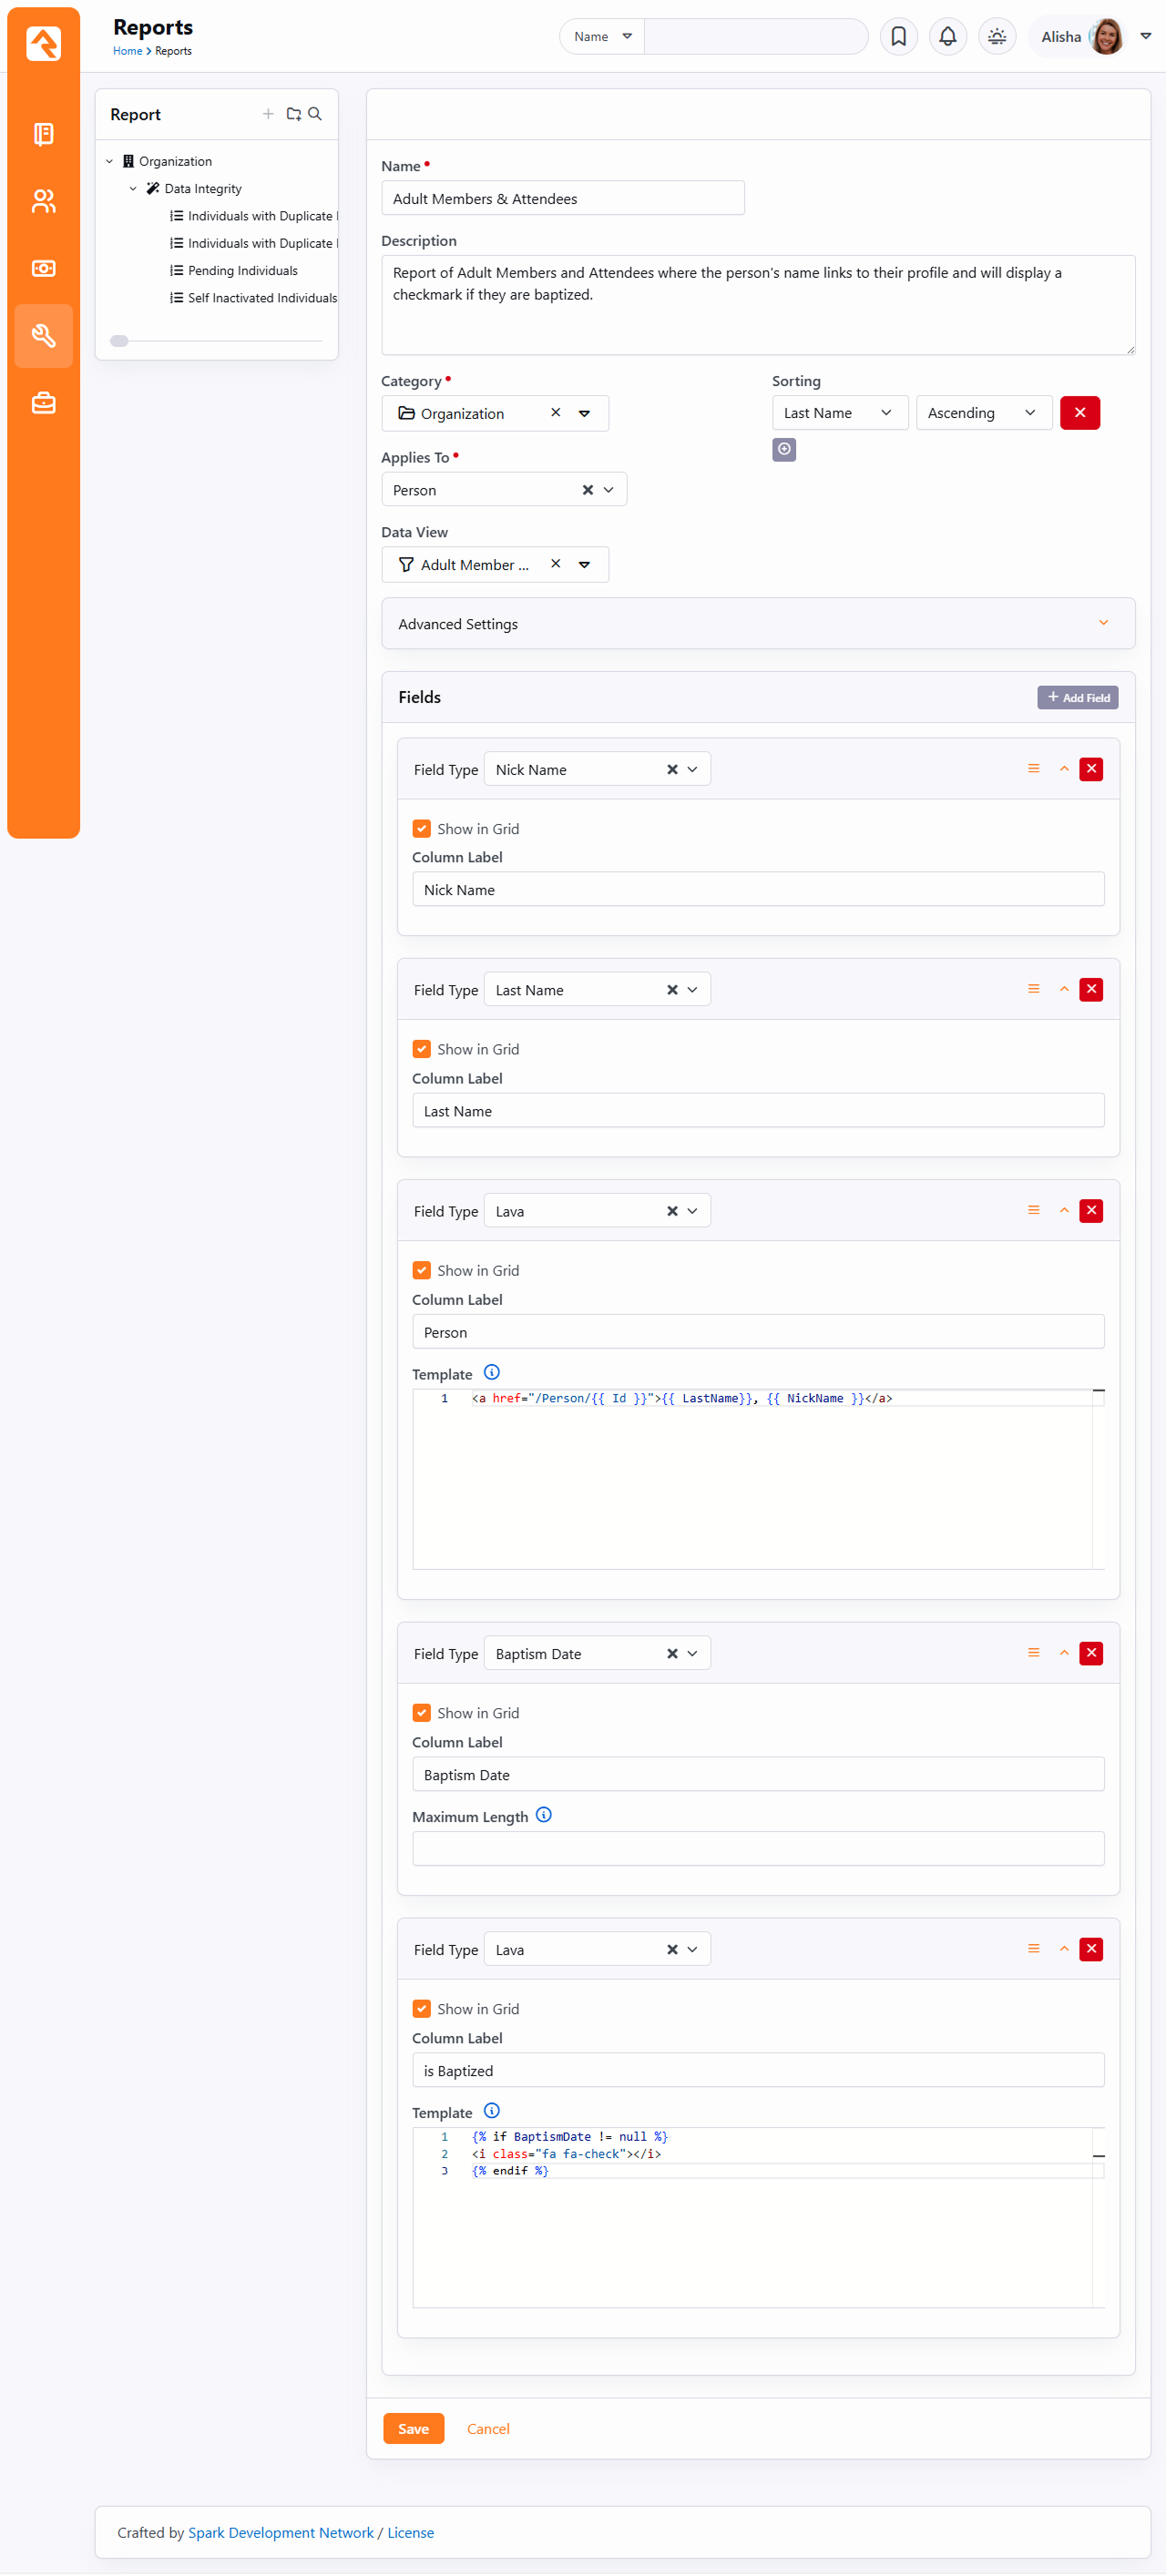
Last Name, Nick Name
{{ LastName }}, {{ NickName }}
Last Name, Nick Name as a link to the ‘Person Profile’ page
<a href="/Person/{{ Id }}">{{ LastName }}, {{ NickName }} </a>
If baptized, show field as a checkmark
{% if BaptismDate != null %}
    <i class="ti ti-check"></i>
{% endif %}
For some fields (like Phone Number), use the dot notation to get the property you want
{{ Phone.NumberFormatted }} unlisted: {{ Phone.IsUnlisted }}
Let's pull this all together: this setup would create a report where the person's name links to their profile, and display a check mark if they are baptized:
Editing a Report
We should point out that usually you could simply use the stock Person Name field to create a linked name formatted this way,
without using Lava. But if you wanted to link to an alternate person profile page, this would give you full control over doing that.
You can find out more about Lava on the Rock RMS learning website.
If you want more information on using Lava in merge documents, you'll find that in the
Rock Admin Hero Guide.
Let's Go Farther:
You can also create your own custom report fields with some developer knowledge. See
our
developer docs
for all the details.
Persisted Data Views in Reports
As you'd expect from our earlier discussion, if your report is based on a persisted Data
View, the report should display much more quickly than if the Data View wasn't persisted.
That's because it's not having to figure out which rows to display- that's already been
calculated, so it'll just use that list.
And if your report is based on a persisted Data View that also references other
Data Views, it doesn't actually matter (at the report level) whether those nested Data Views
are persisted or not. That's because the "top level" Data View that the report is using, is
persisted. So, it's not actually having to go and look up those nested Data Views at all in
order to generate the report. Neat, huh?
Securing Report Data
It’s important to know that anyone with access to a report will be able to view all the data
in that report. This includes data they wouldn’t normally be able to access elsewhere in Rock.
In effect, report data bypasses the person’s security rights. That might sound alarming at first, but
don’t worry. Rock was intentionally designed this way, and we have some suggestions for securing
your data.
First, you might be wondering why security is not applied to report data. If Rock were forced to
apply a person’s security to the rows returned in a report, there would be two problems:
- Sometimes you want to bypass security for valid reasons. For instance, let’s say you have a
report that lists people who have donated to your organization so you can send handwritten thank
you cards. This report doesn’t show specific gifts but does use giving data to list the individuals.
The person tasked with writing the cards probably doesn’t have access to financial data
in Rock. If the person’s security were applied to the data in the report, the report would not
give them results because it references financial data. Now they can’t do their job and the only
solution is to give them security they don’t need.
- Performance. Let’s say your report provides a list of group members and their group. If security
were enabled, the system would need to run a security check for each row in the report to see if
the person viewing the report has access to the group. Remember, the security on a group is
hierarchical on group structure, group member role and on the group type. All of those areas would
need to be evaluated. You can see how quickly this adds up, even to the point where the report will
time out before results can be returned.
So, what should you do?
It starts with the report’s author. The author is responsible for considering the security of the data
they’re providing. However, keep in mind that security is enforced at the time of authoring. For instance,
when building a data view the author can’t exclude groups that they don’t have access to. If group data is
displayed in the report, then those groups will appear on the report, which might not be desired.
Also, don’t forget you can apply security to the reports themselves. Limiting access to the report
ensures the data it contains can only be viewed by the intended individuals.
Another approach is to look for configurations outside of reporting that might provide the security you need.
For instance, if there is a certain type of group you’re concerned with (like a recovery group) make sure those
groups are all of a specific group type. Then you can “apply security” by limiting the group types shown in your
report. You’re not actually doing anything with security but adjusting your configuration in this way can help
ensure sensitive data stays secure.
As you can see, planning is important in developing data views and reports. You want to ensure that the individuals
who can view the report are identified, and that provisions are made so that sensitive information does not inadvertently
leak.
Dynamic Report Block
As you create reports you may find that you need to duplicate Data Views and Reports to solve similar problems. For
instance, your organization may want a list of people who have a background check that's expired or about to expire. Let's say the
report will be used at each of your campuses. You might be tempted to create a data view and report for each
campus, but there is an easier way.
Rock provides a block entitled Dynamic Report
that shows a specific report but also allows you to display
filters of the report’s underlying data view and allows the person viewing the report to modify them. Let’s see our report in action.
Dynamic Report Block
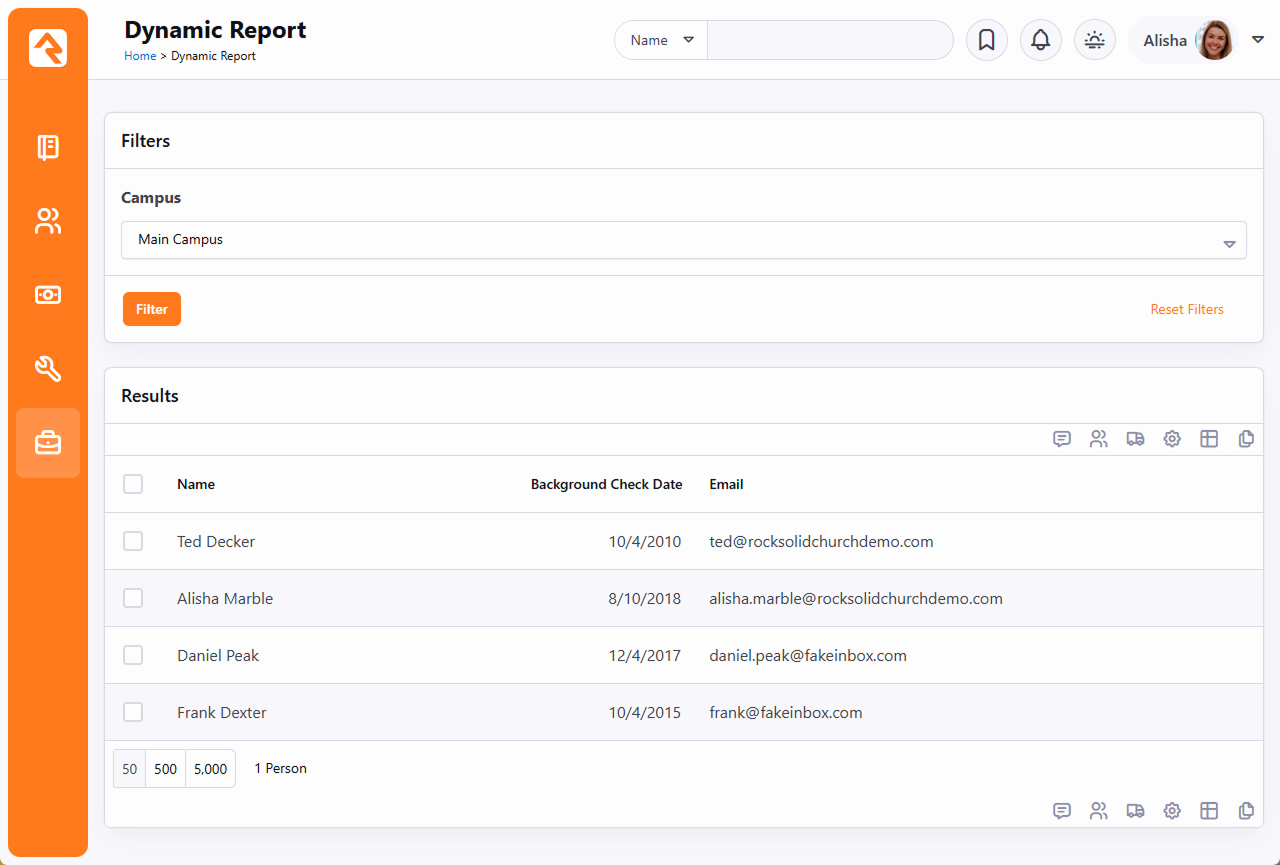
As you can see, the block looks like the standard report grid with the
addition of a filter from the data view near the top. Let's walk through
the steps to recreate this.
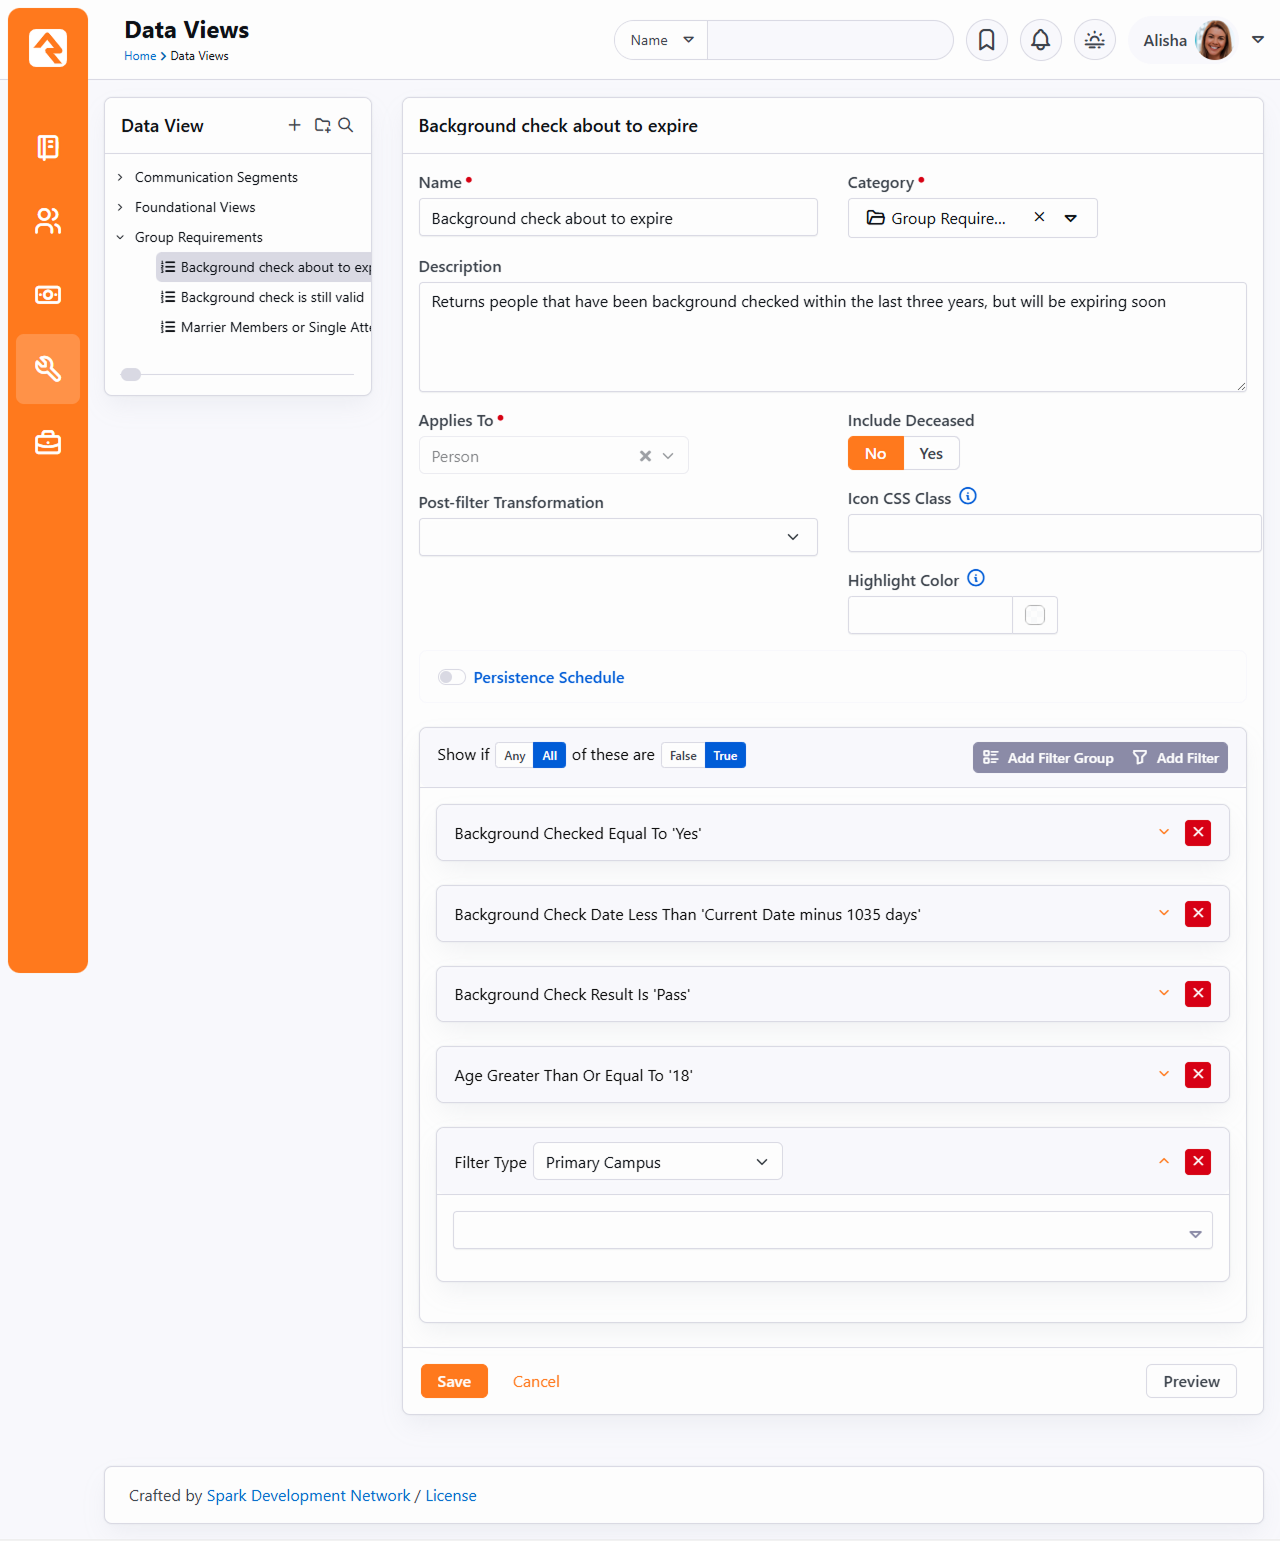
Create Data View
The first step is to create the data view under Tools > Data Views
that will drive the report. Here we have a few filters: campus and our background check logic. Notice that we
leave the campus blank. This basically says, "show any campus," which will be our "default."
Data View Configuration
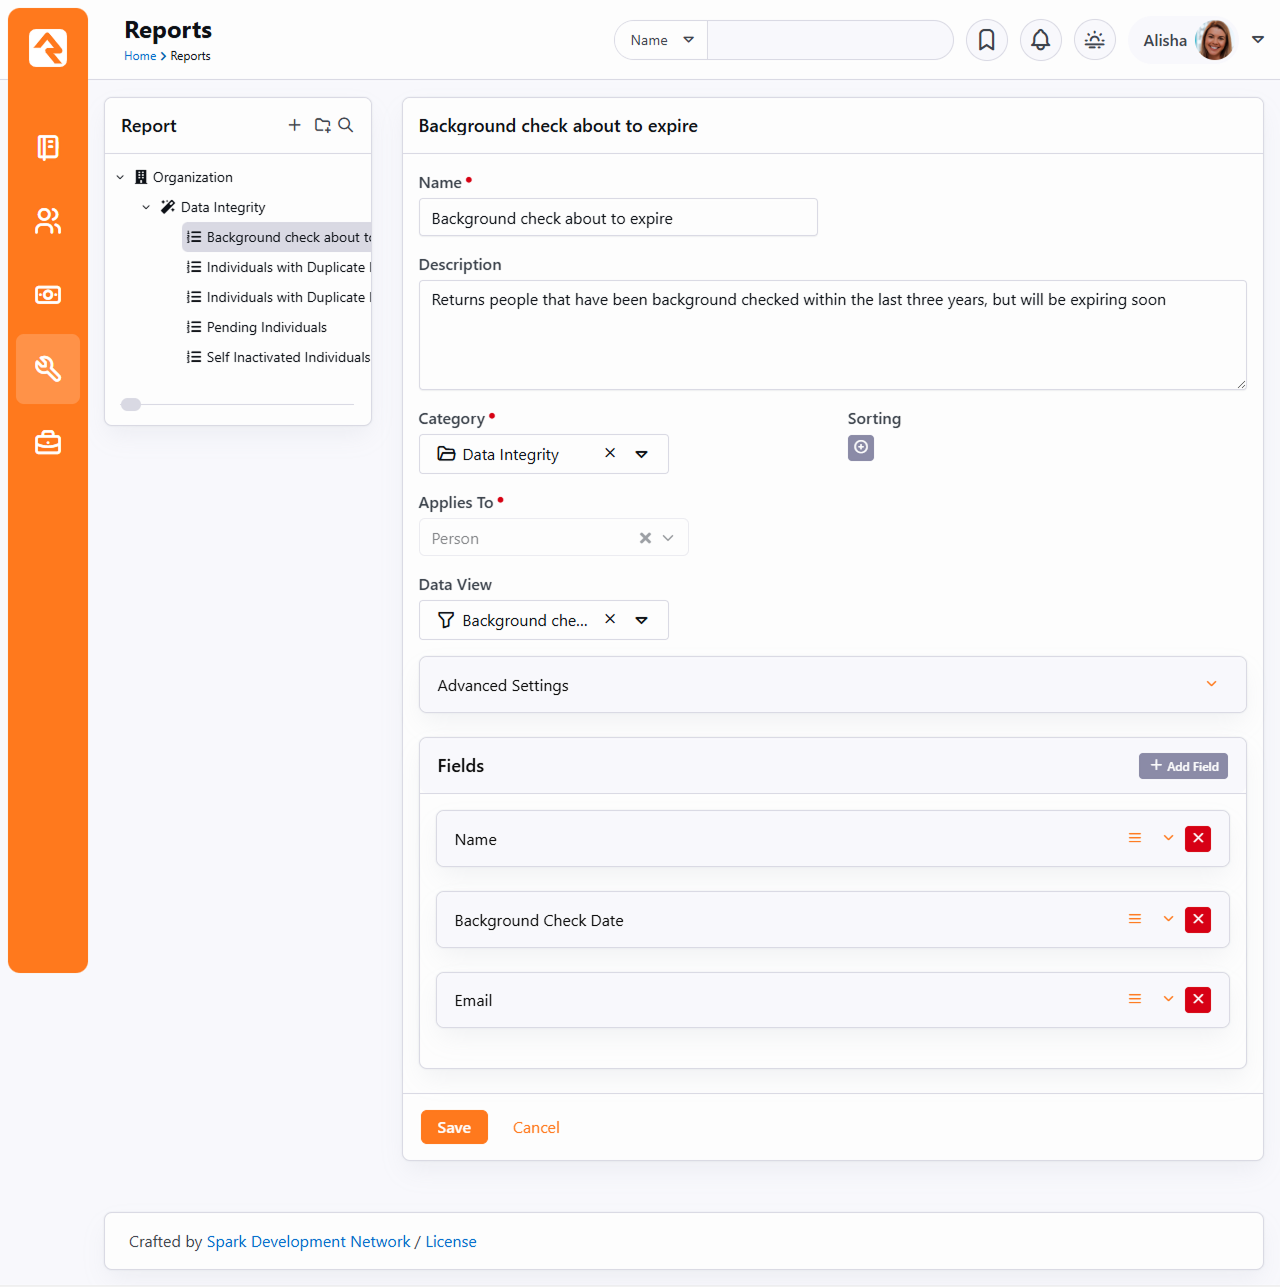
Create Report
Next, we create the report under Tools > Reports. Here
we add in the columns we’d like to display on the report. Nothing new here.
Report Configuration
Set Up Dynamic Report
Finally, we’re ready to add our Dynamic Report block. After
creating a new page and adding the block, we can set the block's settings. Below is a screenshot of what's possible.
Block Settings for Dynamic Report
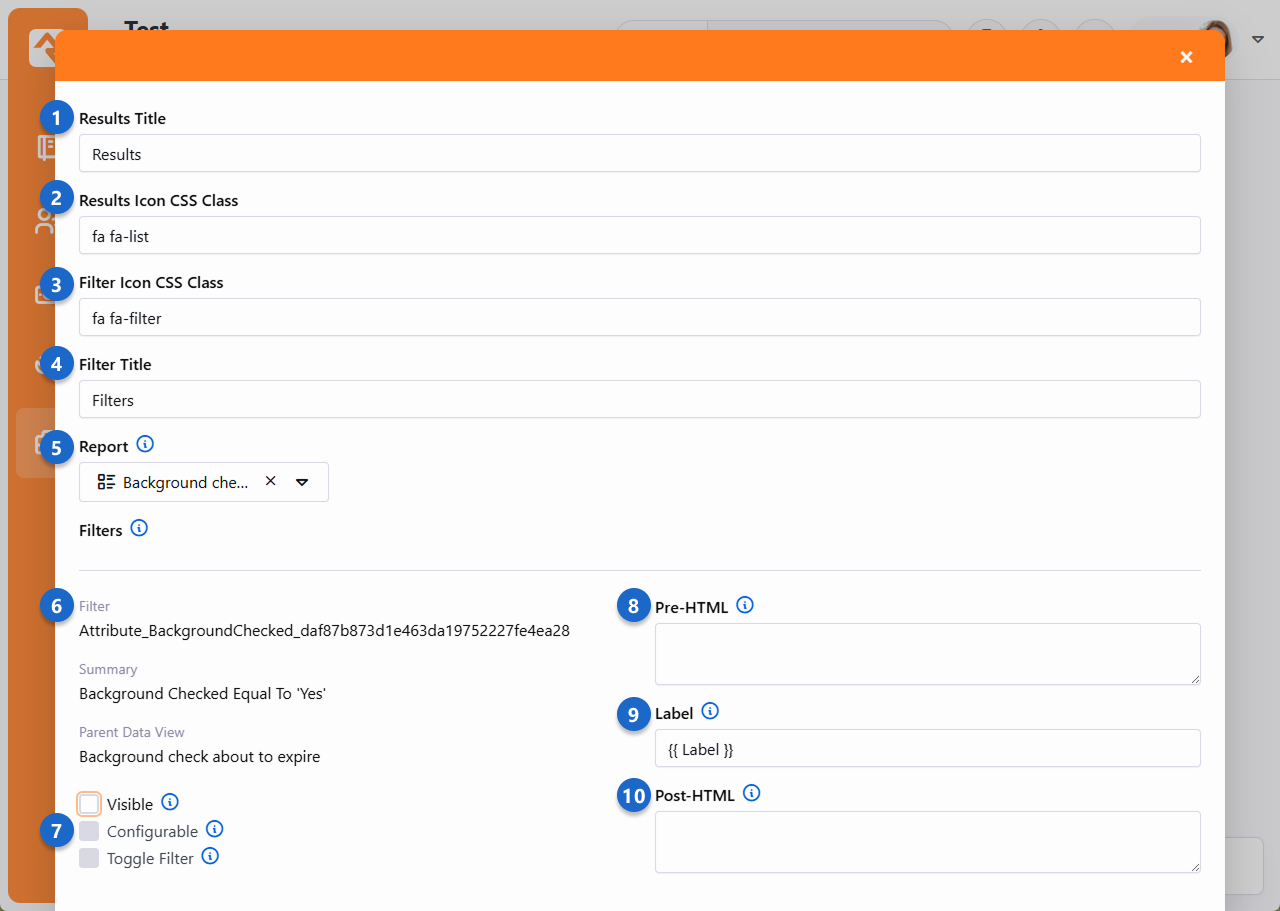
- 1 Results Title
- The title text to use for the results grid.
- 2 Results Icon CSS Class
- The CSS icon to use for the same grid.
- 3 Filter Icon CSS Class
- The CSS icon to use for the filter panel.
- 4 Filter Title
- The title text for the filter panel.
- 5 Report
- The report we created in step 2.
Filters:
After selecting a report, Rock will look at the data view for that report and list its filters. Each filter includes the following options:
- 6 Filter
- The data in "Filter" is what can usually be used in a URL parameter to pre-set a filter where you'd type text. For instance, a "First Name" field might show a filter of
Property_FirstName, in which case a URL like /page/123/?Property_FirstName=Ted would pre-fill and pre-filter the report for people with a first name of Ted. Note that Campus and Campuses are special cases; since these aren't text boxes, try using ?CampusId=1 or ?CampusId=1,2 to set these.
- 7 Options
- For each filter in your Data View, you'll be able to configure these options which control whether the person using the report can specify which filters are used:
- Visible: This tells the block whether the filter should be shown to the
person for them to modify. In our sample we're only letting them change the campus, so only the campus filter
would have this checked.
- Configurable: Determines if the person should be allowed to modify the criteria of the filter.
At first you might think this odd, as when would you ever not want to allow the criteria to change, but it'll
make sense when combined with the next option.
- Toggle Filter: This setting will show the filter with a checkbox next to it. Unchecking the box will
disable the filter entirely.
- 8 Pre-HTML
- This is HTML which will be shown before the filter option at the top of the Dynamic Report block. You can use this to group controls together in a well, or change their widths using Bootstrap classes, for instance.
- 9 Label
- The text you put here will determine what title the person will see associated with the filter. The default value of
{{ Label }} will display the title of the filter from the source Data View filter.
- 10 Post-HTML
- This is HTML which will be shown after the filter option at the top of the Dynamic Report block. You can use this together with PreHTML to create some neat effects and change the layout of your filters.
The
Dynamic Report block allows you to control the
filtration of multiple data views. If your report uses a data view that is based on another data view, you can set your filter to look at only the top-level
data view or to use both.
As you can see, the Dynamic Report block is very flexible and powerful. Once you create your
first one, you'll find it's one of the most popular tools in your toolbox.
Dynamic Data Block
Most of your reporting needs can be met using Data Views and Reports. However,
if you have unique requirements that can't be addressed with these tools—or if you want
a more customized experience—the Dynamic Data Block provides a flexible solution.
You should be able to use data views and reports to meet most of your reporting
requirements. If you have a special requirement that can’t be met, or you prefer a
different user experience than what reports provide, there is the Dynamic Data block.
When you add a Dynamic Data block to a page (see the
Designing and Building Websites Using Rock
guide for details on adding blocks to pages), you have the ability to craft the display of
filtered data. Let's walk through the various options of this block.
Some settings depend on whether you're using Grid or
a Lava Template for Results Formatting.
We'll start with the Lava Template option which covers the first six common settings.
Dynamic Data Block - Lava Template
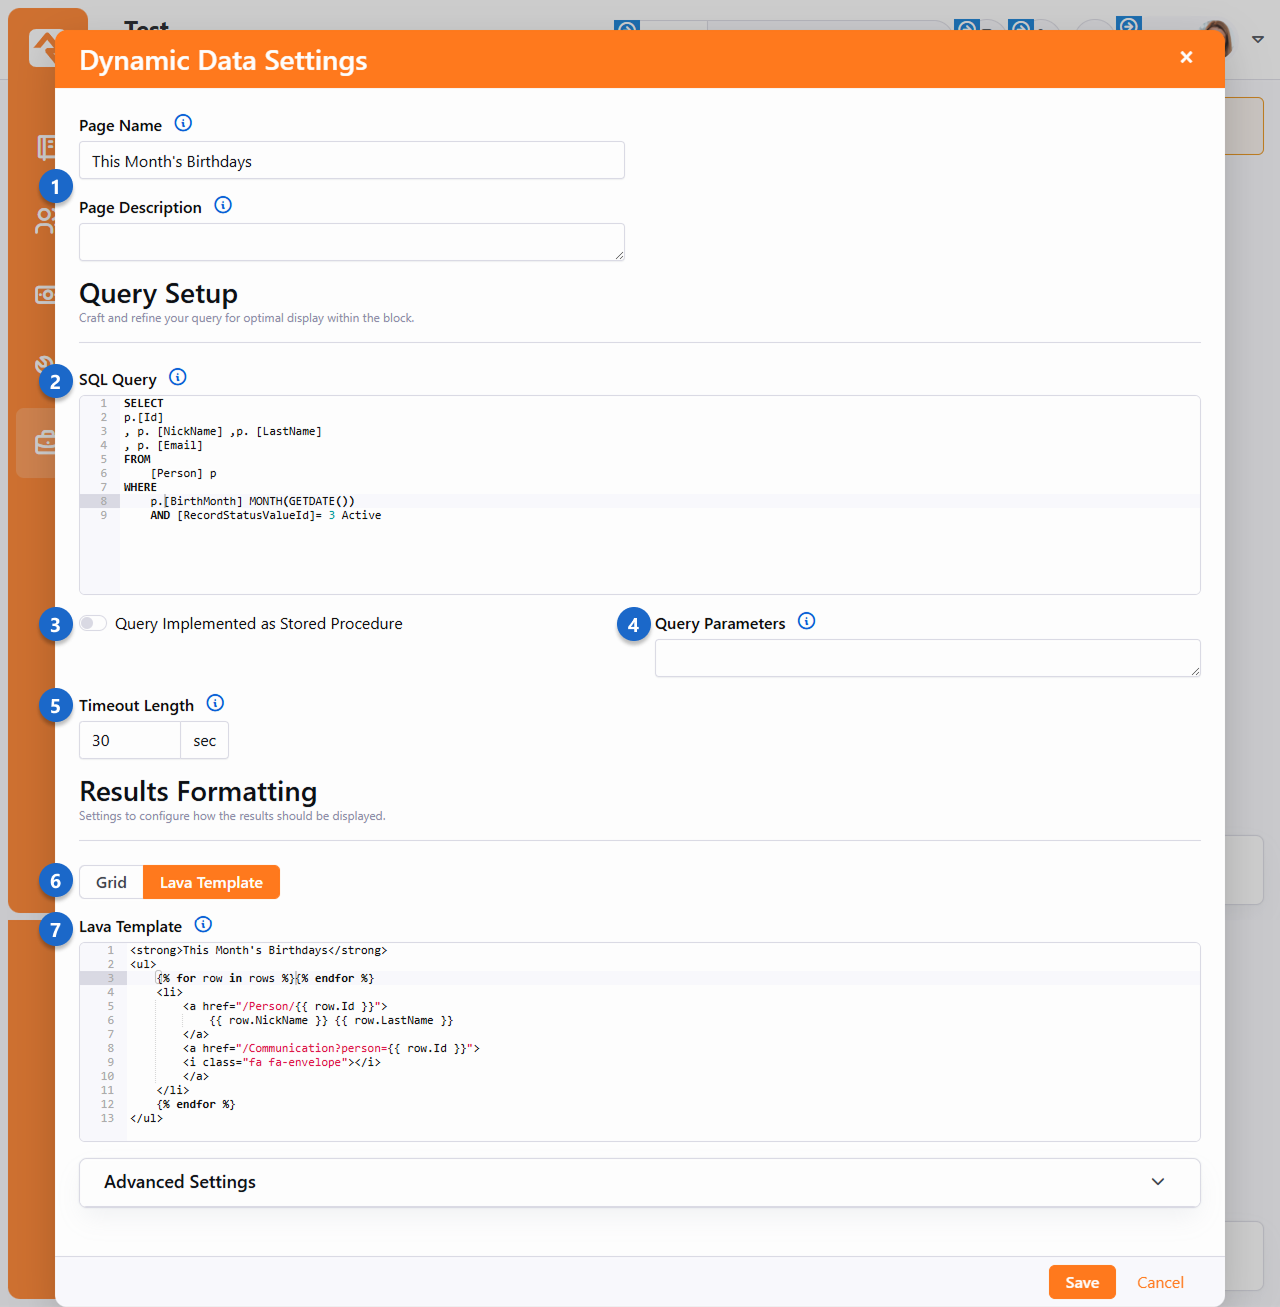
- 1Page Name/Description
- This allows you to reset the title and description of the page from within the block. The ability
to do this is controlled by the Update Page block setting
discussed later.
- 2SQL Query
- This is the SQL query or stored procedure call (more on procedures
below) for defining
the data to be displayed. SQL is a standard reporting language used by most databases.
There are plenty of resources online for learning its syntax.
- 3Query is a Stored Procedure
- This setting tells Rock that you will be calling a stored procedure, as opposed to using a straight SQL statement. This
allows Rock to configure any parameters needed for the stored procedure.
- 4Query Parameters
- When using stored procedures, you can pass in parameters to create dynamic filters.
More on this feature is covered below in the
Extra Power from Stored Procedures
section.
- 5Timeout Length
- As a safeguard against queries that take too long to run, you can specify a timeout period
(in seconds). If the query exceeds this limit, it will stop running.
- 6Results Formatting: Lava Template
-
By default, the query will be shown as a grid on the page. If you'd prefer, you can
select Lava Template and provide a template that will be used to transform the query results into your own custom
layout. This is incredibly powerful because you can start to create your own
mini-applications
using these dynamic data blocks for displaying data. The
Column Configuration section will only display if
Grid
is selected. Grid is covered in the next example.
- 7Lava Template
- This is where you put your custom Lava template that will be used to format the query results output.
This version of the Dynamic Data block makes it easy to tap into the power of Rock's new grid system, allowing
you to create a great viewing experience when using the Grid
Results Formatting option.
Dynamic Data Block - Grid
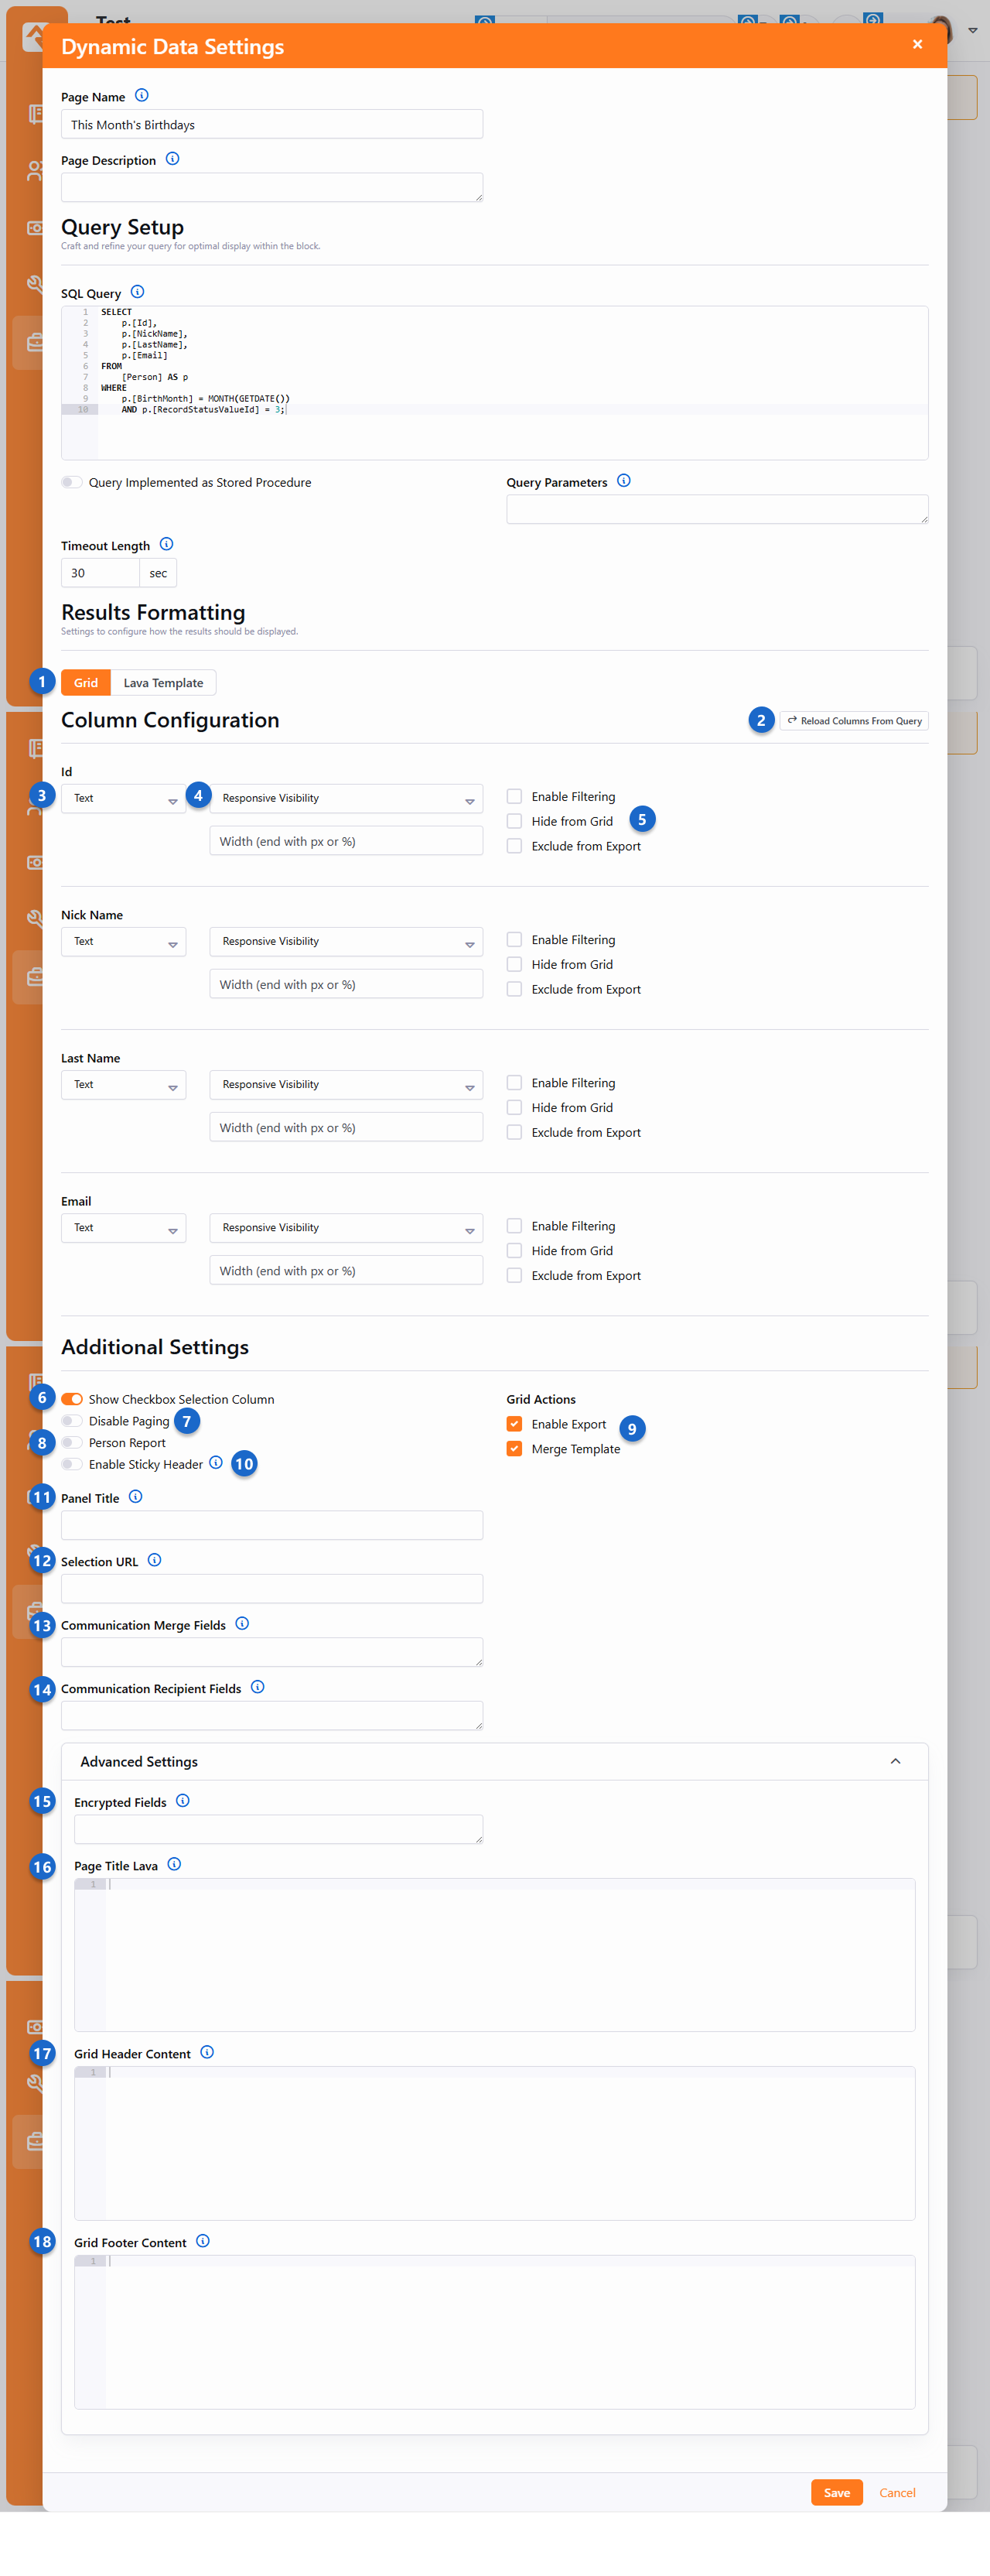
- 1Results Formatting: Grid
-
Selecting this option displays query results in a grid format. When using the Grid, the
Column Configuration section appears,
enabling you to customize how columns behave.
- 2Reload Columns From Query
-
When you first supply a SQL Query, the Column Configuration
section will be empty. Click this button
to read your query to set up configuration options for each column. Use this button again whenever
you modify the
SELECT columns in your query to refresh the available configuration settings.
- 3Column Type
-
This setting controls how each column in your SQL query is displayed and behaves.
Think of it as a way to tell Rock what kind of data is in each column — like numbers, dates, or text — so it can
properly format the data and make it easier to work with.
- Text: Displays values as plain text, perfect for names, descriptions, or labels.
- Boolean: Shows values as "True" or "False," useful for yes/no or on/off data.
- Currency: Formats values as monetary amounts, adding the appropriate currency symbol and decimal places.
- Date: Displays only the date, such as "01/03/2025," for when the time portion does not exist or is unimportant.
- DateTime: Displays both the date and time, such as "01/03/2025 2:30 PM," for more precise records.
- HTML: Supports custom HTML formatting, ideal for rich text, links, or content you've styled in your
SELECT.
- Number: Formats values as numbers, making them sortable and usable for calculations.
- Person: Beautifully formats the value as a person record, making it easy for you to 'wow' your staff members.
- 4Response Visibility
-
This field controls whether a column is shown or hidden based on the size of the viewer's web browser window.
It allows you to optimize reports for different screen sizes, ensuring that important information is always visible,
while less critical details appear only on larger screens.
- Extra-Small: Always visible, even on very small screens, such as mobile devices.
- Small: Shown on slightly larger screens, like small tablets.
- Medium: Displays on medium-sized screens, such as larger tablets or small desktops.
- Large: Visible only on larger screens, like standard desktops or laptops.
- Extra-Large: Shown on very wide screens, such as large monitors.
Width: For even more control, you can specify a custom width for a column using either pixels (px)
or percentages (%). For example, use 200px for a fixed width of 200 pixels, or 50%
to make the column take up half the available space.
- 5Column Options
-
These dynamic options depend on the Column Type selected earlier. The most common options are:
- Enable Filtering: Controls whether or not the column should include an appropriate filter.
- Hide from Grid: By default, all the columns returned by the SQL query or stored procedure will be displayed.
This is helpful if your SQL defines columns that you want to be displayed when exporting to Excel or CSV,
but not displayed on the page.
- Exclude from Export: Prevents the column from being included in exports.
- 6Show Checkbox Selection Column
-
Adds a checkbox to each row for use with Grid Actions, such as exporting or launching workflows for a subset of results.
- 7Disable Paging
-
By default, the grid shows the first 50 results and provides paging options to view more.
Enable this option to turn off paging and display all results at once. The choice is yours.
- 8Person Report
-
If your query returns a list of people, you'll want to enable this option. This will add
several feature options that are specific to listing individuals. Be sure that your query
returns the Id field so
that these features will work as planned.
- 9Grid Actions
- Lets you pick which grid actions are available on the dynamic report. You'll see additional
options depending for
Communicate,
Person Merge,
Bulk Update and
Launch Workflow if the
Person Report option is
enabled.
- 10Enable Sticky Header
-
Enabling this means that the grid's column headers will
stay visible on the screen as you scroll down the list of results.
- 11Panel Title
-
Here you can provide the title for the grid's results panel.
- 12Selection URL
-
The URL someone is redirected to when they click on a row in the grid. Any column's
value can be used in the URL by including it in braces. For example, if the grid includes
an Id column that
contains Person Ids,
you can link to the Person view, by specifying a value here of
~/Person/{Id}.
- 13Communication Merge Fields
-
List any field you want to be available on the communications page as merge fields.
- 14Communication Recipient Fields
-
This is where you can specify which column(s) contain a Person Id field, to use as the
recipient for a communication. You don't need to use this if your query has a Person Id
column named "Id".
- 15Encrypted Fields
-
This option allows a report to decrypt any fields that are returned from the query as
encrypted values. For example, if you create a report that displays Social Security Numbers
and those numbers are stored in a person attribute with the SSN field type, the values in
the report will be encrypted. Adding the SSN value to the
Encrypted Fields will
result in the values being decrypted before being displayed in the report. (Note: a
Decrypt filter
is available in the
Text Filters section of
the
Lava
manual.
- 16Page Title Lava
-
This allows you to set the page's title with Lava. You can also use data from the result set(s).
- 17Grid Header Content
-
This allows you to set the grid's header content with Lava. Just like the Page Title Lava, you can use
data from the result set(s).
- 18Grid Footer Content
-
This allows you to set the grid's footer content with Lava. Just like the Page Title Lava, you can use
data from the result set(s).
Source From the Example
Below is an example like the one above.
SQL
SELECT
    [Id]
    , [NickName]
    , [LastName]
    , [Email]
FROM
    [Person]
WHERE
    [BirthMonth] = MONTH(GETDATE())
    AND [BirthDay] = DAY(GETDATE())
    AND [RecordStatusValueId] = 3
Lava
<strong>Today's Birthdays</strong>
<ul>
    {% for row in rows %}
        <li>
            <a href="/Person/{{ row.Id }}">
                {{ row.NickName }}
                {{ row.LastName }}
            </a>
            <a href="/Communication?person={{ row.Id }}">
                <i class="ti ti-mail"></i>
            </a>
        </li>
    {% endfor %}
</ul>
Important! When writing your query, it is important the [Id] field for the person starts with a capital 'I'.
If not, links to send communications will not work.
That Figure Is More Than an Example...
The settings for the example above will list out all the people in the database whose birthday is the
current date as a bulleted list linked to send an email. Throw that on your internal homepage and go
buy yourself a coffee!
Now that you're familiar with how to set up the Dynamic Data block, you might want to know about
the block settings that are available.
Dynamic Data Block Settings
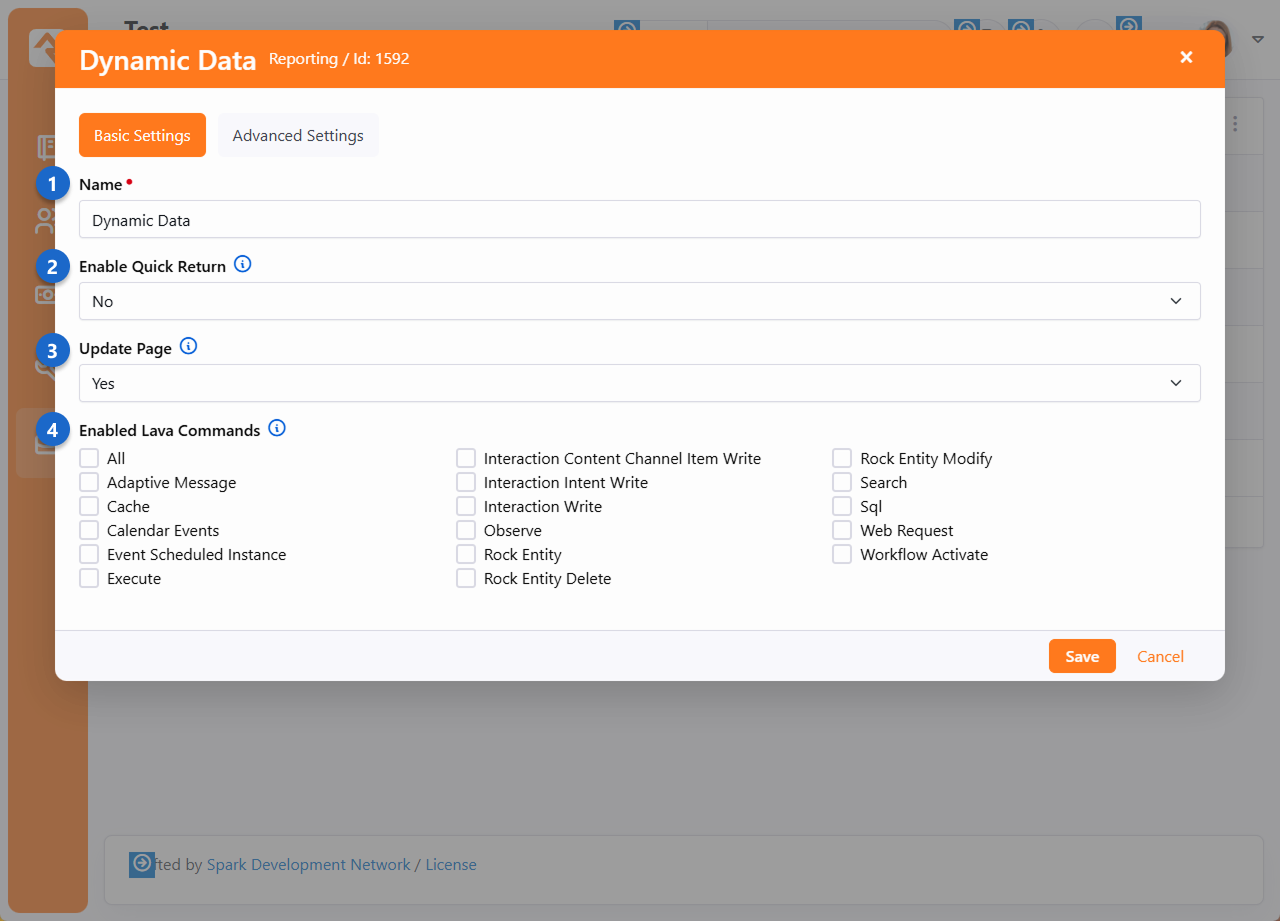
- 1 Name
- In most cases the default name will work, but you can change the name of the block
if you want to.
- 2 Enable Quick Return
- If this is enabled then people who visit this page will have it added to their
Quick Returns
bookmarks. If you have multiple Dynamic Data blocks on the same page, only
one of them should have this enabled.
- 3 Update Page
- This setting, when enabled, lets you change the page's Name and Description
by editing the block as described above.
- 4 Enabled Lava Commands
- You may need to enable one or more of these if you're including Lava in your
Dynamic Data block.
Extra Power from Stored Procedures
OK, we're going to geek out here for a second... By using
SQL Server Stored Procedures, it can get even more powerful. When calling a stored
procedure, you can pass the procedure any of the query string parameters from the URL.
For instance, if the page the block is placed on is accessed from the URL:
https://<your server>/page/123?GroupId=12
You can pass the value of the GroupId to your stored procedure as a parameter. The
stored procedure can then use this value to help return relevant data (say group
members for the group).
You can also pass in the current person's person Id field. This allows you to further
personalize the data to the person requesting the page. Just think of all the fun you
can have with this block!
In order to make this all work, you'll need to define each of the parameters you want
passed to your stored procedure in the Parameters
field discussed above. Rock will look for each of these parameters in the URL’s query
string and, if found, pass in the value to the procedure. If you would like the
current person’s Id to pass in, you'll likewise need to add in the parameter
CurrentPersonId.
Inception Time
This functionality gets truly powerful when you have dynamic data blocks calling
dynamic data blocks. So, you might have one dynamic data block that lists every
serving group in your database. Then it links to a different page passing the
selected group id, with a dynamic data block that shows the group members. Using
the Lava template option, all of this can be designed to make the pages look
like custom application logic. BAM!
Page Parameter Filter Block
The Page Parameter Filter block is an easy way to add some powerful functionality to your pages. In short, it works by
adding page parameters to a URL according to selections made within the block itself. For instance, if the block is
used to select a Connection Opportunity, then the URL will be updated with a page parameter that holds the GUID of the
selected Opportunity. With the GUID present in the URL, it can now be referenced by other blocks or features.
Configure Block Settings
When the block is first added to a page it won't have any functionality until it's configured. The block settings you'll
use to do this are described below.
Page Parameter Filter - Block Settings
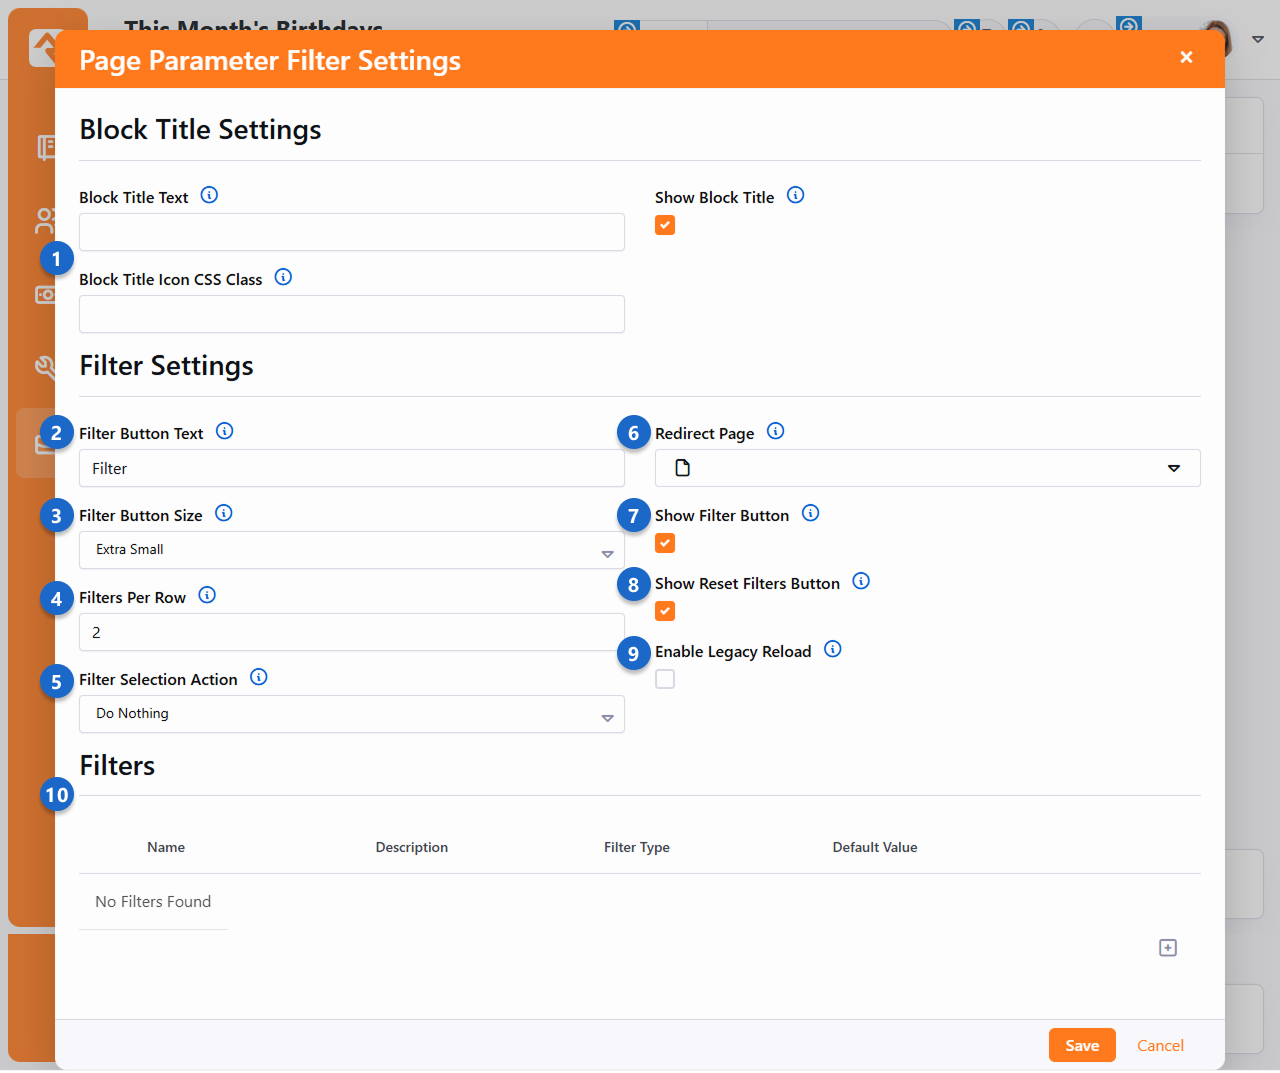
- 1 Block Title Settings
- Similar to other blocks, you can customize the options for the block's title area using the fields provided.
- 2 Filter Button Text
- By default, the button to apply the filter is labeled as "Filter" but can be customized to your liking.
- 3 Filter Button Size
- The size of the Filter
and
Reset Filters
buttons can be changed here. The default value is "Extra Small", but you can also select
"Small" or "Normal" to make the buttons slightly larger.
- 4 Filters Per Row
- This setting controls how many filters are displayed in a single row within the block. This doesn't impact anything
if you have only one filter.
- 5 Filter Selection Action
-
This setting determines what happens when a non-textbox filter is selected:
-
Do Nothing:
No changes occur automatically. The viewer must manually click the filter button to apply their selections.
-
Update Filters:
Filters whose available values depend on the selected values of other filters will update automatically, but the viewer must still click the filter button to apply them.
This is useful when filters rely on virtual page parameters
This is useful when filters rely on selected values from other filter (via virtual page parameters).
If Enable Legacy Reload
is enabled, page parameter changes will appear in the query string instead of being virtual (i.e.,
invisible).
-
Apply Filters: All filters are applied instantly, without the need to click
the filter button.
- 6 Redirect Page
- If you provide a page here, the person will be redirected to that page as soon as they click the
Filter button. The
URL for the target page will include page parameters for the selected filters (see next section for details).
- 7 Show Filter Button
- If enabled, the Filter
button will be visible. Typically, you'll only want to hide the button if the
Selection Action
(see below) is set to
Update Page.
- 8 Show Reset Filters Button
- You can choose to hide the Reset Filters button if needed.
This will keep the filter's information in the URL after it has been applied.
- 9 Enable Legacy Reload
-
If enabled, a full page reload will be triggered to apply the filter selections (helpful when using this block to drive the behavior of non-Obsidian/legacy blocks on the page). If disabled, the filter selections will be communicated directly to any Obsidian blocks listening for these filters, so they can respond accordingly.
- 10 Filters
- This is where you'll add the filters that should be available for selection in the block. Adding filters to this block
is like adding attributes to an entity. We'll look more closely at an example in the next section below.
Adding and Using Filters
If you've ever added an attribute to a person, group or other entity, then you're already familiar with adding filters to this
block. As pictured below, these filters use many of the same fields as attributes.
Page Parameter Filter - Create New Filter
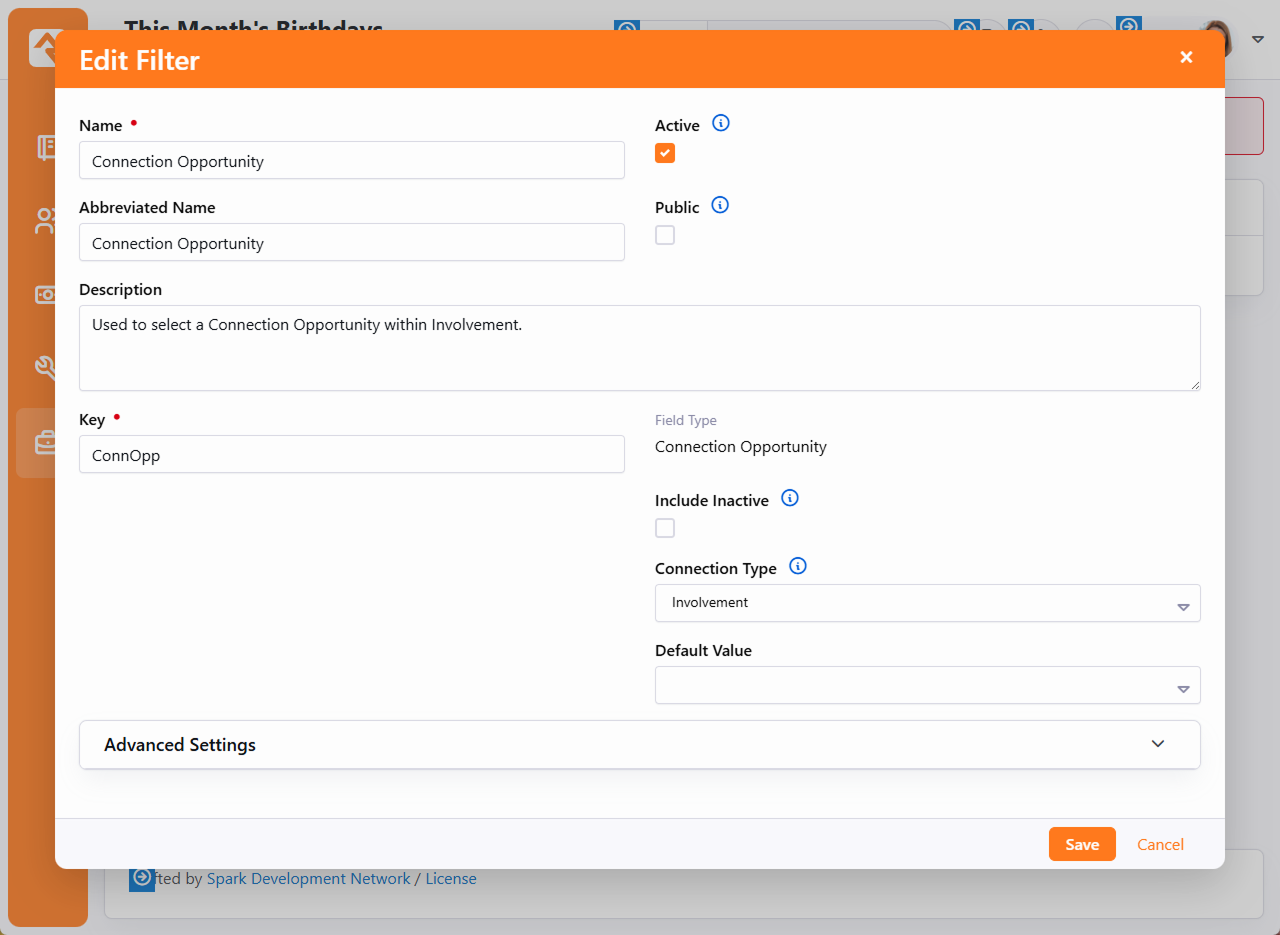
The Key value you choose for the filter will appear as the name of the parameter
in the URL after the filter is applied. You'll need to reference this value later, so try to pick something unique and descriptive.
In the example pictured above we've added a filter with a field type of "Connection Opportunity". As a result, a person accessing the page will be
prompted to select a specific opportunity. We're only using a single filter here, but you can add as many filters as you need. Each filter functions
independently from the others, so you can use a variety of different field types.
Page Parameter Filter - Select Value
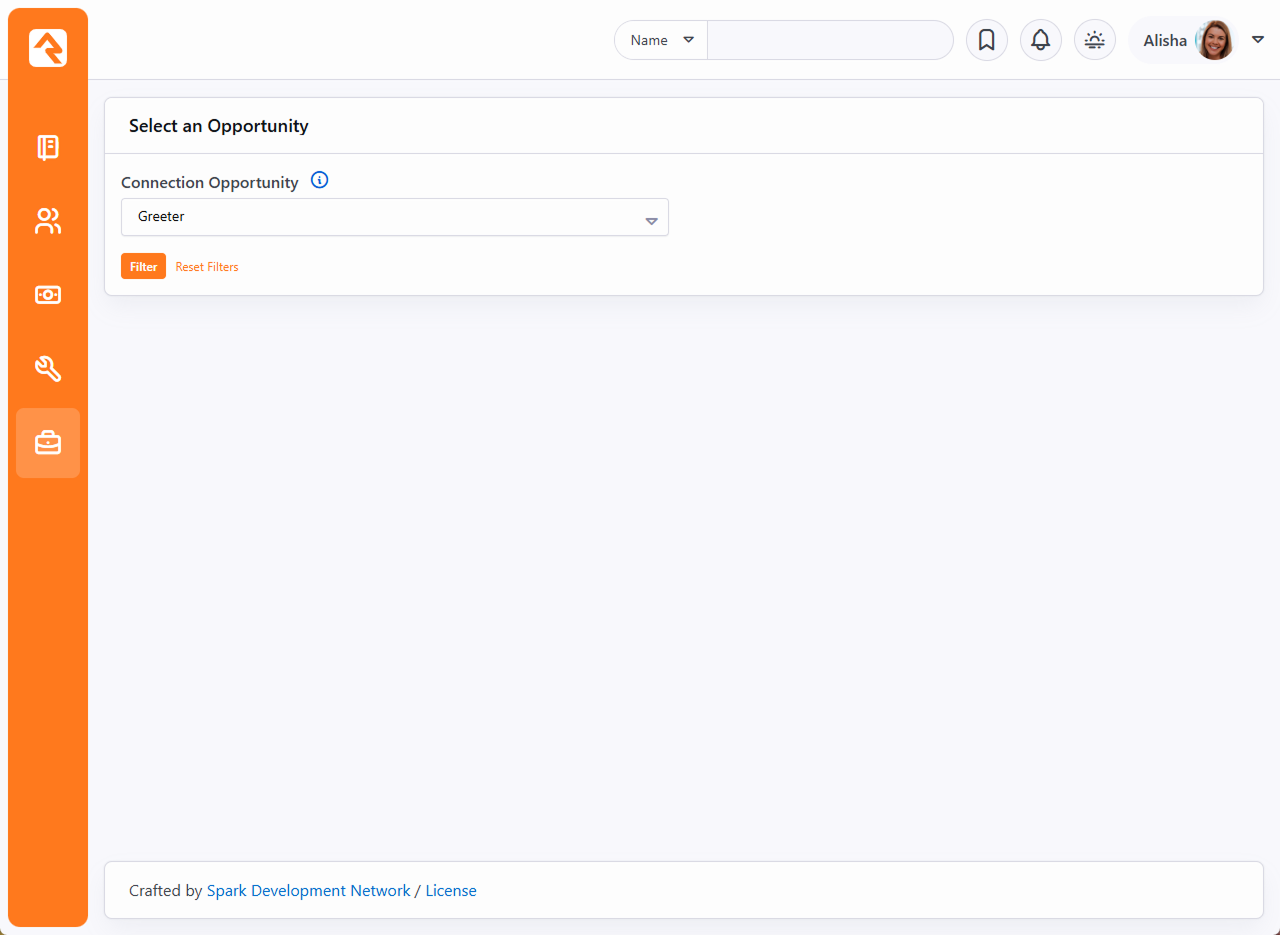
Now that a value has been selected the person should click the Filter
button to apply it. Depending on your setup, the Filter button will do
different things. It might redirect the person to a new page, or it could cause data to change in another block on the same page. In any case, it will
update the URL with the filter's Key and the value of the person's selection.
Using our connection opportunity example, you can see below how the Key ("ConnOpp")
and the GUID (of the "Greeter" opportunity) have been added to the URL.
Before:
https://rocksolidchurchdemo.com/page/123

After:
https://rocksolidchurchdemo.com/page/123?ConnOpp=6A7935B2-A97D-4F9D-82B3-4F835533325F
If you configured the block to redirect people to a different page, then the filter information will be appended to the URL of the target page in the same way.
This can be very useful if the target page has a block that expects this information to already be in the URL, which won't happen until after the person clicks
the Filter button.
Page Parameters and Lava
When combined with Lava, this block becomes a powerful tool that can be used in a variety of ways. All you need to do is add
{{ 'Global' | PageParameter:'ConnOpp' }} to a workflow, report or anywhere else Lava is used. Just replace "ConnOpp"
with the Key for your filter, and the doors are open.
Some blocks, like the HTML Content block, will need to have the RockEntity command enabled for this Lava to work. Pictured below
is a basic example of an HTML block using the GUID of a connection opportunity to display the number of requests in the opportunity.
Page Parameter Filter - Use in HTML
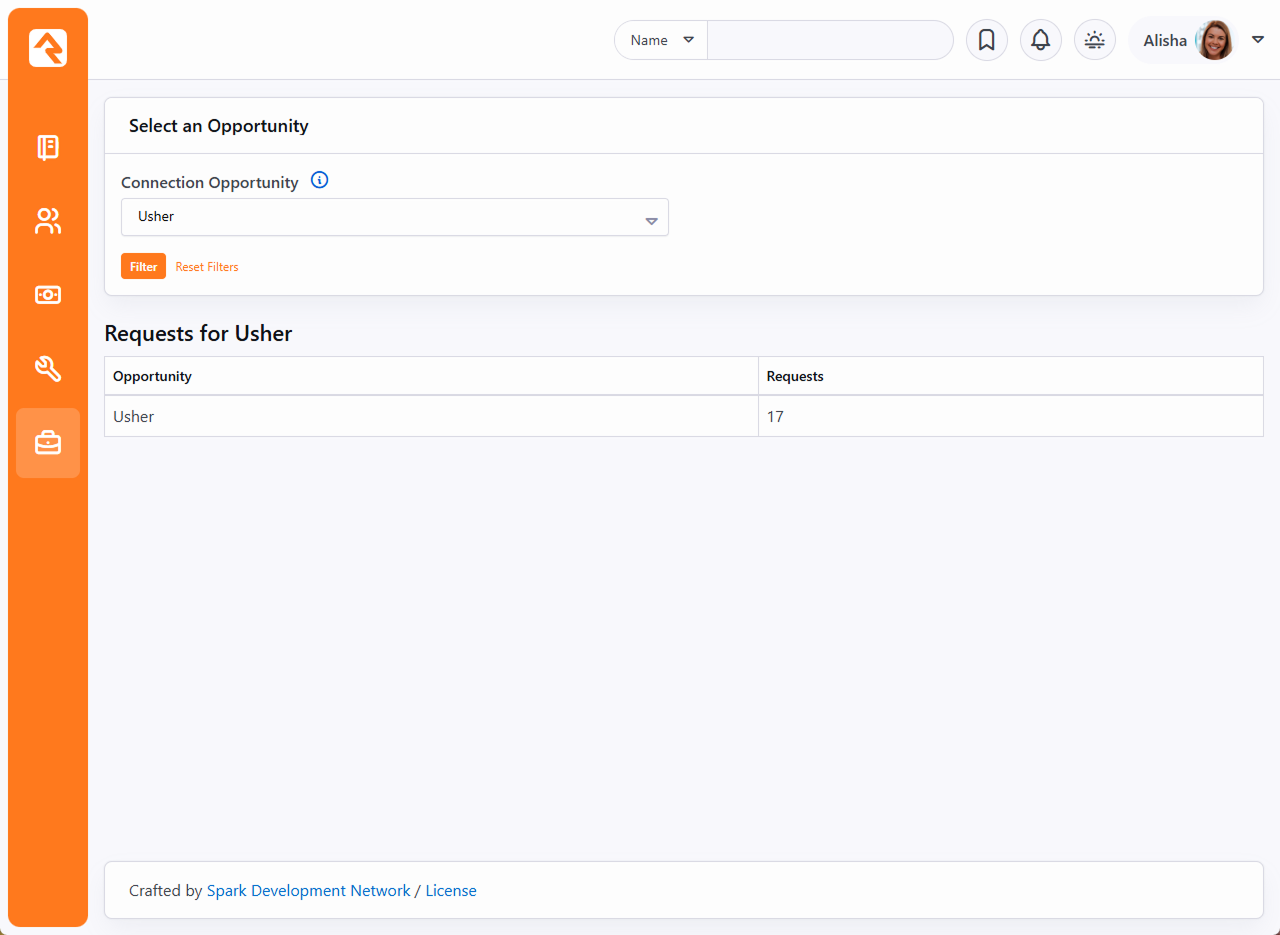
See our Lava
documentation for more information.
Metrics
"What’s measured improves."
-Peter Drucker
Using metrics can help provide your organization with a framework for improvement by tracking
key performance indicators. Metrics describe what’s going on under the hood of your
organization.
Rock includes a full set of features for tracking and displaying metrics. First let's
walk through how we define metrics and then we'll look briefly at how we can present
metrics in some useful ways.
Example Metric
Anatomy of a Metric
Metrics are defined with categories, very similar to data views and reports. This
allows you to organize them in a way that makes sense for your organization. One
thing that is unique about metrics is that they can be linked to more than one
category. This allows you to re-use them in several areas of your metric hierarchy.
So how do we create a new metric? Administrating metrics is done under
Tools > Metrics.
For our example we'll create a new metric that displays the number of adult members
and attendees we’ve had each week. Here are the details of the completed metric with
callouts for each field.
Metric Edit
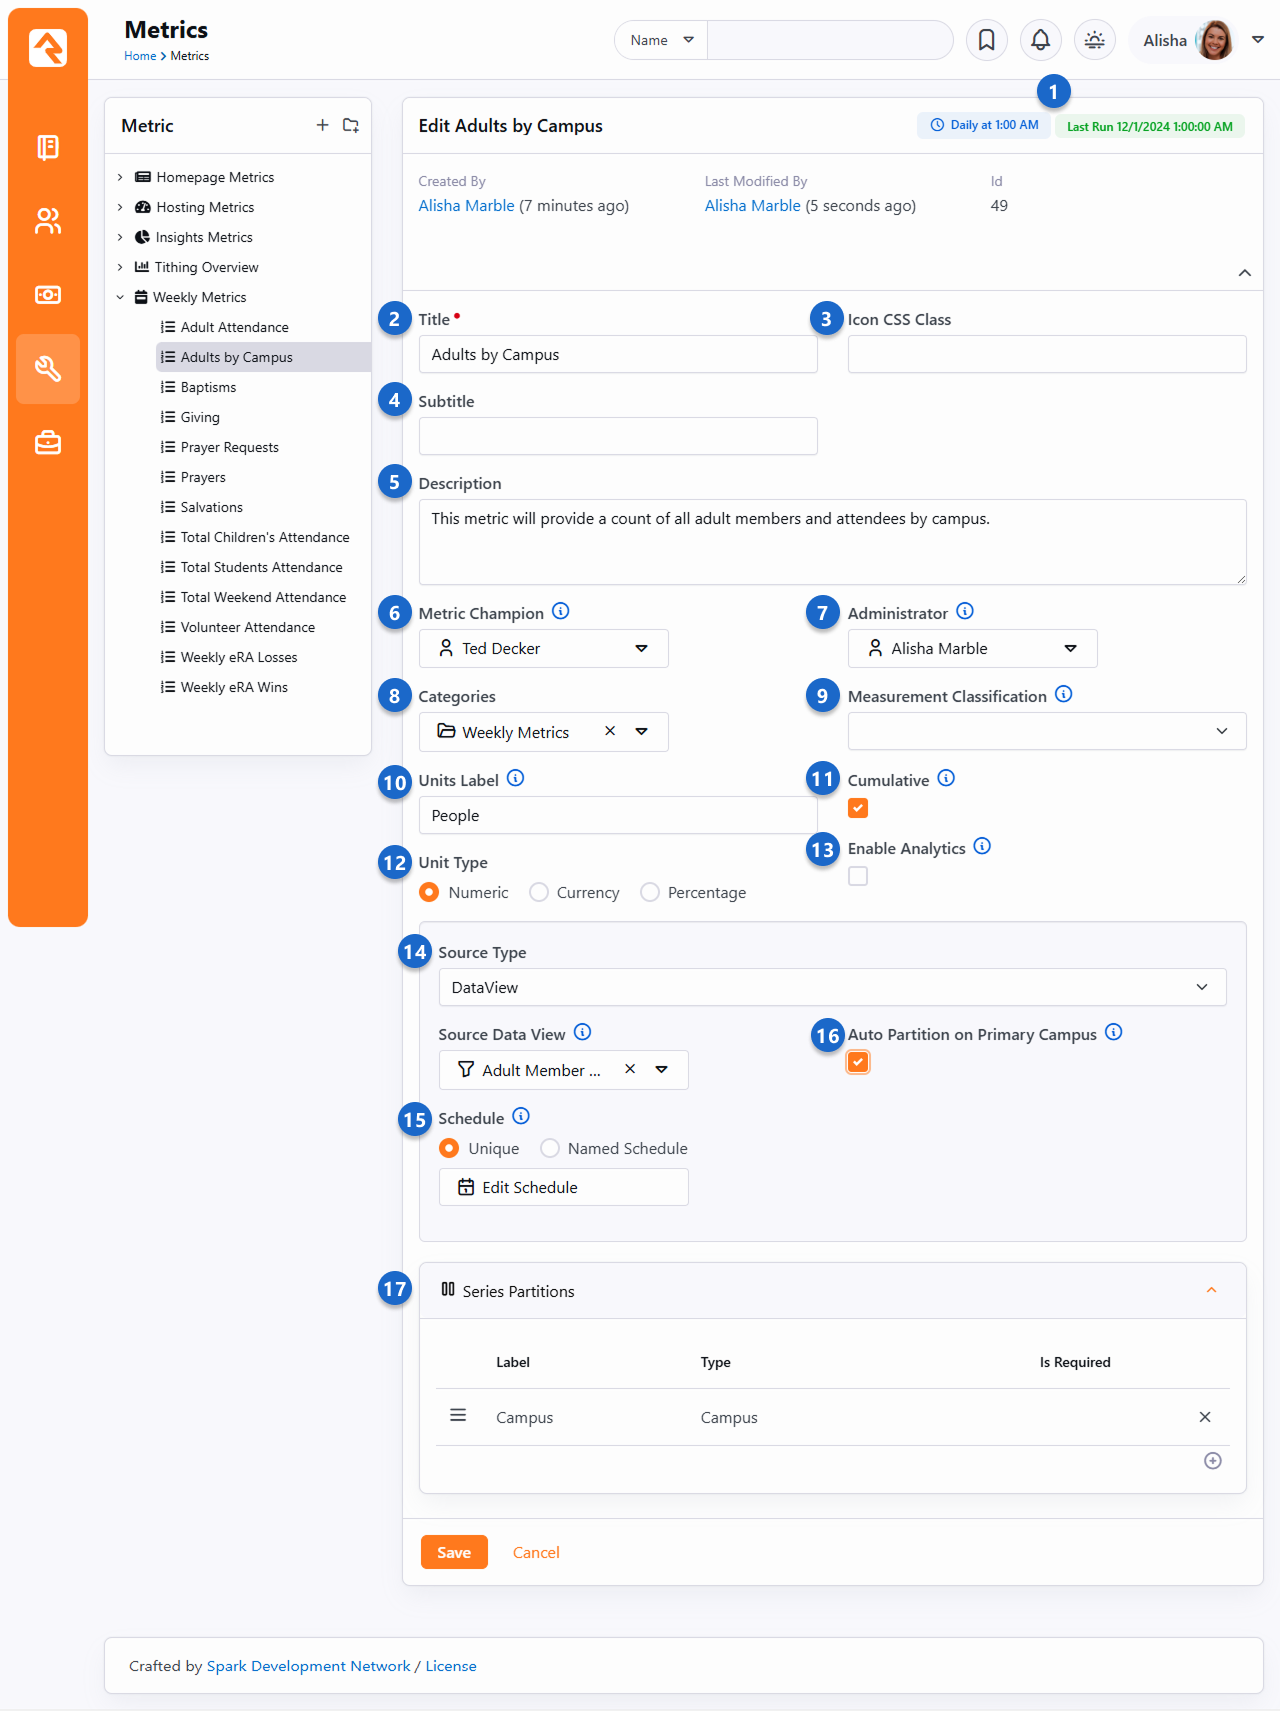
- 1 Schedule and History
- At the top of the page, you can see the current schedule this metric is running on, and the last
time the Metric was run.
- 2 Title
- Be sure to provide detailed titles for your metrics that not only
make sense to you, but also to those who will be using these metrics in the future.
- 3 Icon CSS Class
- The CSS class of the icon you wish to associate with the metric. This is used in the
display of the metric. Rock uses the Font Awesome
icon set by default, but any CSS based icon set can be used if properly configured.
- 4 Subtitle
- The subtitle will be shown on graphs and charts.
- 5 Description
- You'll be tempted to just skip right over this field, but you'll regret that in the future. No matter
how obvious you feel this metric is, future you is screaming for you to add details about what is being
measured, how it's calculated, any filter specifics (like only members), etc. Be kind to future you
and document as much as you can. When you're done, go ahead and thank yourself ahead of time.
- 6 Metric Champion
- One of the keys to good metrics is good documentation. In that regard we’ve
worked hard to be sure that metrics become self-documenting. The metric champion
allows you to note the person in your organization who is responsible for confirming
that this metric is meeting its goals.
- 7 Metric Administrator
- The metric administrator is the individual in your organization who is
responsible for ensuring that the metric data is entered correctly and is valid.
- 8 Categories
- This field allows you to link your metric to one or more categories.
- 9 Measurement Classification
- Classifies the metric, to ensure it’s known what the metric is measuring. For instance,
the Total Weekend Attendance classification would be tied to the single metric that’s used for tracking total weekend
attendance. This enables the system to utilize these metrics for analytics. See below for additional details.
- 10 Units Label
- The y-axis label describes the units of what is being measured (people, groups,
money, etc.)
- 11 Cumulative
- Some metrics make sense to compare year-to-date, others - not so much. For
instance, it's often helpful to look at year-to-date values for adult members and
attendees.
But a metric that tracks attendance for a service or event often does not make sense
to evaluate the same way. This field allows Rock to know if cumulative comparisons
make sense for this specific value.
- 12 Unit Type
- Metrics can track different types of data, so you can use the
Unit Type
setting to tell Rock you're working with numbers, currency or percentages.
What you choose here will determine how the metric values appear in different
areas, like on the metric's chart. For instance, if you select
Percentage
then the y-axis on the chart will show 10%, 20%, etc.
- 13 Enable Analytics
- Check this box if you want the metrics to be made available for use by
analytic tools such as Power BI.
- 14 Source Type
- The source type defines how the metrics will be entered into the system. The options are:
- Manual: Metric values will be entered in manually.
- SQL: A SQL statement will be run to populate the values. Once you select this option a SQL entry input will be displayed. The help menu for the
SQL field provides in-depth information on how your SQL should be formatted.
- Data View: A data view will be executed, and the count of its values will be added
to the metric with the date it was run. The help field here also displays information on configuring your data view.
- Lava: Lava will be used to generate the values. When you select this option,
a Source Lava field will be displayed. This is where you add your Lava code. The help
menu offers examples of Lava that could be used for metrics.
To learn more about Lava, go to https://community.rockrms.com/lava.
- 15 Schedule
- The metric schedule helps determine how often this metric is calculated. When
used with the SQL, Lava and Data View source types, this field will actually tell Rock
when to automate the harvesting of metric values.
- 16 Auto Partition on Primary Campus
- Data View source types don't support partitions, with one exception. If your data view returns people, and
if you only have a single Partition of type Campus, you can select this option to have the metric
return people by campus.
- 17 Series Partitions
- For simple metrics you're done, you can skip this section. Often times though you want to break
your metrics down by campus, or maybe campus then service time. Setting up series partitions allows
you to do just that. You always get the date partition (that's free), but you can set up as many partitions
as you feel necessary (but more than two can get a bit complex).
Supercharge Your Metrics with Lava
Using Lava as the data source for your metrics is powerful. With Lava entity commands you can now access data
from external systems and include it in your reporting. For example, you can use the web request command to make
remote API calls and pull bank account balances from your accounting system, data from Planning Center, or info
from Church Metrics. When it comes to Lava and reporting, the sky is the limit! To learn more about Lava, go to
https://community.rockrms.com/lava.
Measurement Classifications
Measurement Classifications help
Rock unlock deeper insights from your metrics by adding meaning and
context to the data they capture. Each metric in Rock can be assigned a specific classification that
indicates exactly what that metric measures. For example, you might classify a metric as "Total Weekend
Attendance" to give Rock a clear, consistent understanding of that data point across all systems.
The Measurement Classifications
that ship with Rock are listed below:
- Total Weekend Attendance: This metric measures the total weekend attendance for the organization, partitioned by campus and schedule.
- Volunteer Attendance: Measures the number of volunteers that served for the given week. Partitioned by campus and schedule.
- Prayer Requests: The number of active prayer requests for the given week. This metric should be partitioned by campus.
- Prayers: The number of prayers for the given week. This metric should be partitioned by campus.
- Active Families: The number of active families in the given week. This metric should be partitioned by campus.
- Baptisms: The number of baptisms in a given month. This metric should be partitioned by campus.
- Giving: This metric represents weekly giving. It's up to you to define the financial accounts that make up this metric.
This metric should be partitioned by the campus of the financial account. Review the account list in this metric to decide if you want
to modify the
@Accounts variable.
- eRA Weekly Wins: Tracks the number of individuals who attained eRA status within the current week. This metric should be partitioned by campus.
- eRA Weekly Losses: Monitors the number of individuals who exited eRA status in the current week. This metric should be partitioned by campus.
Using one metric for each classification ensures that we have a single, reliable source of truth for
critical data like attendance or giving. This accuracy allows Rock to automate tasks, create reports, and
even generate future features that draw directly from your specific metrics, tailored to match what each
metric represents. Without Measurement Classifications,
Rock could only see raw data points. Now, it knows what each one means.
Measurement Classification
To use Measurement Classifications
effectively, select the correct classification for applicable metrics
and be sure to configure your metrics precisely as specified. Each classification is associated with a
Defined Value, which outlines essential configuration requirements for that metric. Think of these requirements
as a blueprint. They help ensure the data tagged with a classification fits consistently within Rock’s
framework. If a metric doesn't exactly match these requirements, it shouldn't carry the classification,
since even small discrepancies could lead to inaccurate results.
Total Weekend Attendance
Total Weekend Attendance is a core metric in Rock. It answers a simple question: how many people attended this weekend. It also powers several features that depend on solid attendance totals.
How it works
Rock uses the Metric that uses the Measurement Classification intelligently named... Total Weekend Attendance.
How it's calculated
Out of the box, Rock uses a SQL script that does the following calculation.
Total Weekend Attendance =
Total Adult Attendance
+ Total Volunteer Attendance
+ Total Student Attendance
+ Total Children's Attendance
Where it's currently used
These are only current examples as Rock references Total Weekend Attendance in several areas. Getting this metric right keeps those areas accurate.
Partitions are Important
You can change our SQL if your organization totals attendance differently, but you need to keep the Campus and Schedule partitions so totals roll up and display correctly across reports and dashboards.
We plan to expand how Rock uses this metric over time with more insights and automation.
Entering Metric Values
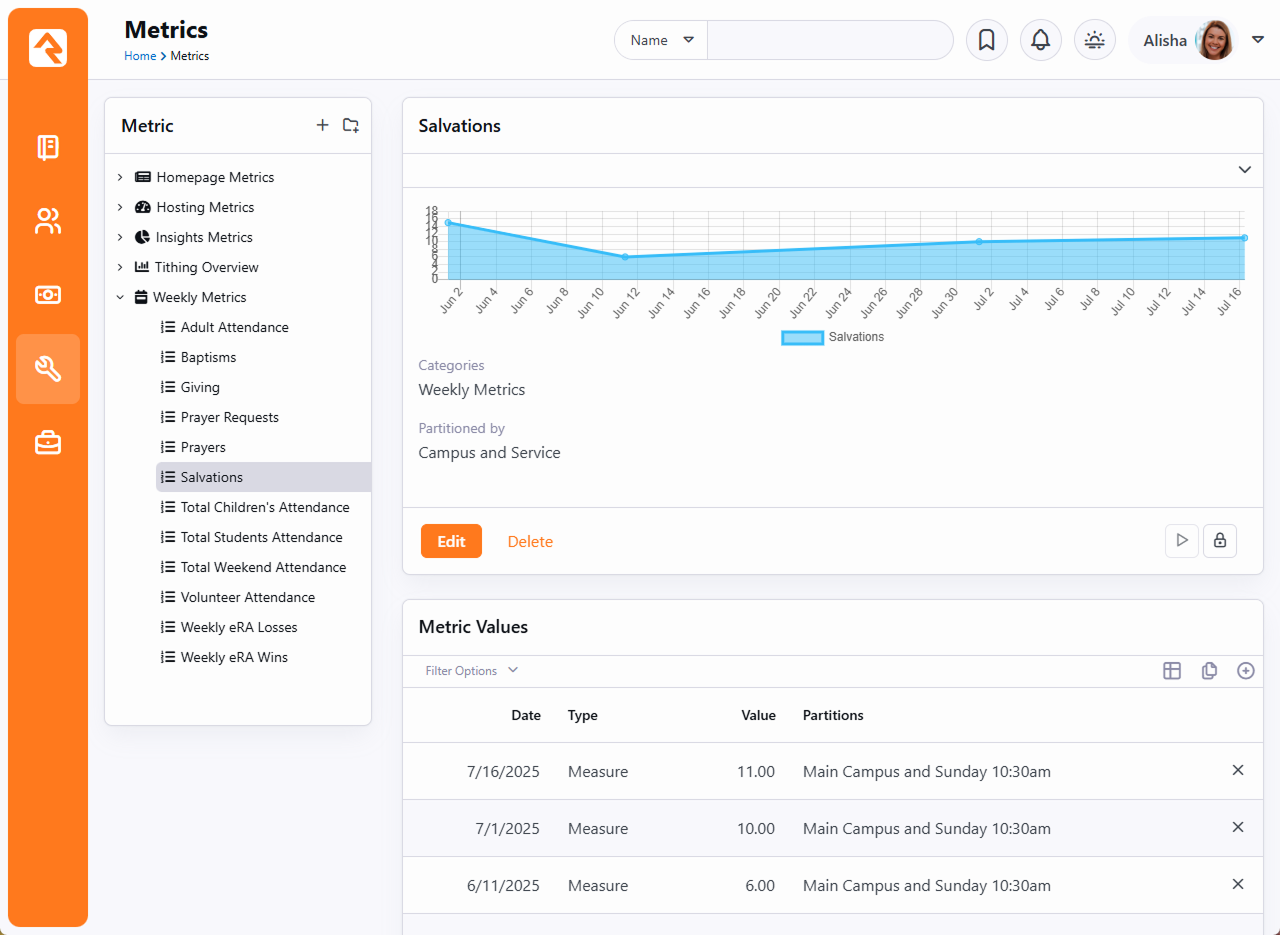
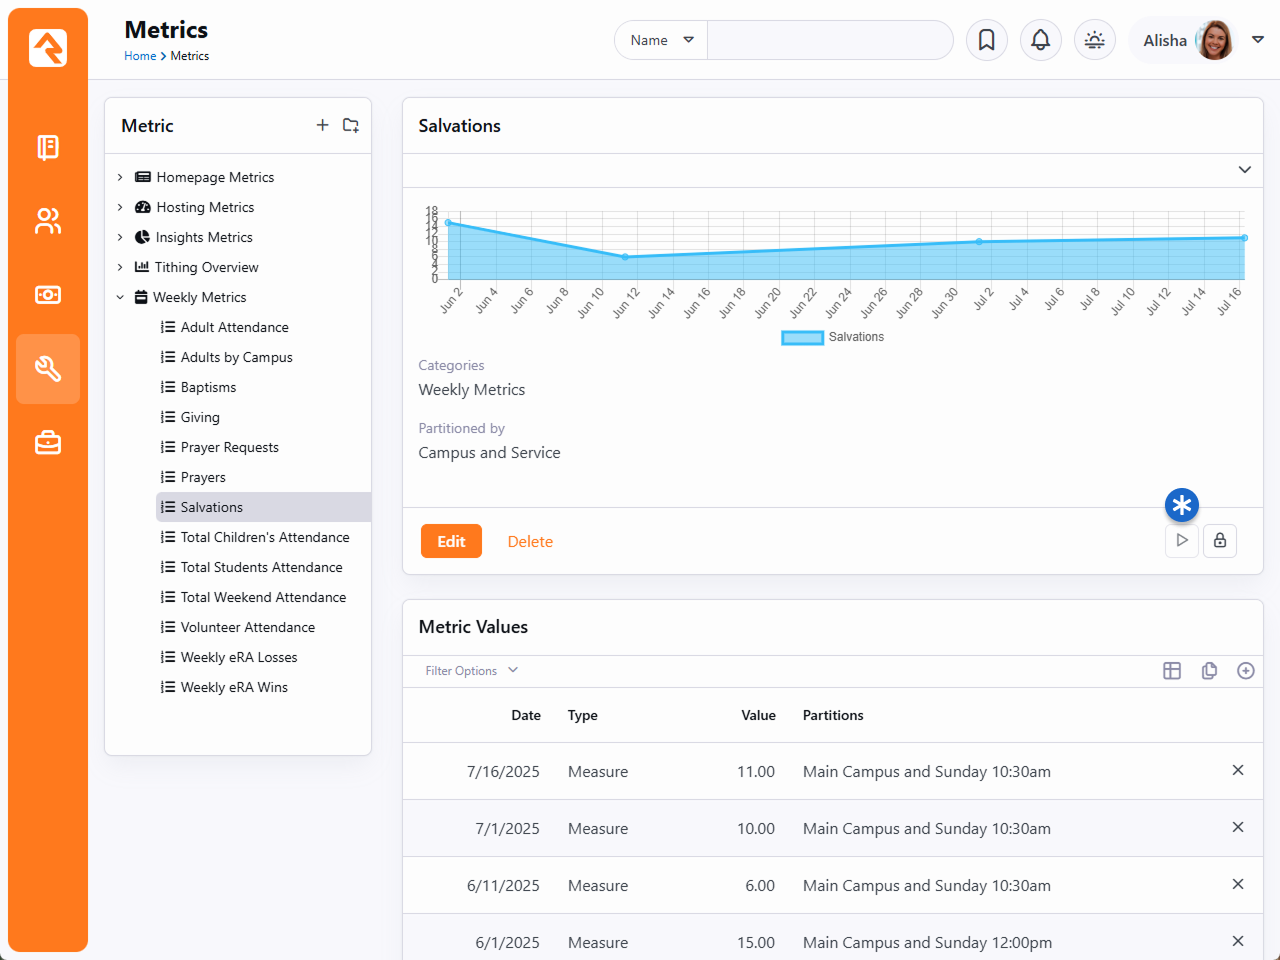
There are two types of metric values you can enter. Each one is discussed in detail below.
Example Metric
- 1Type
- The first entry denotes if this is a measure or a goal. More on the difference between these
two below.
- 2Value Date
- The date that the value is for.
- 3Series Partitions
- If you configured any series partitions, you'll need to select their values here.
In this example there are partitions for Campus and Service.
- 4Value
- The metric measure or goal value.
- 5Note
- A note for the value. This is a great place to document special outliers (like Christmas or Easter) or additional data (like the week's sermon title).
Measures
Measures are the actual values for a metric. In most cases they contain a
date/time and a value. You also have the option to provide a note. This is
helpful to explain outliers or special situations.
Goals
It's often good to track goals for your metrics. This lets you see how well
you're actually doing. Goals can be entered with broad date ranges if you
want. For instance, if you'd like to set a single goal value for the entire
year, you could simply add two goal values. One for January 1st
and the other for December 31st.
Metric Charts
The easiest way to view metrics values is to look at the charts that appear above the
metric definition. This will show you all of the values entered for the metric. You can
edit the
Metric Detail
block's settings to change what the chart shows and how it looks.
If you would like to have more options for displaying metrics, take a look at the
Metrics Dashboards chapter below.
Service Metric Entry
You'll often have the need to enter metrics that follow the partition pattern of
"Campus > Sunday Date > Service Time". We've created a simple entry page
for you to enter these types of metrics into. You'll find this page under
Intranet > Weekly Metrics.
Click the drop-down menus along the top of the block to select the service for which
you want to add metrics.
Weekly Service Metric Entry
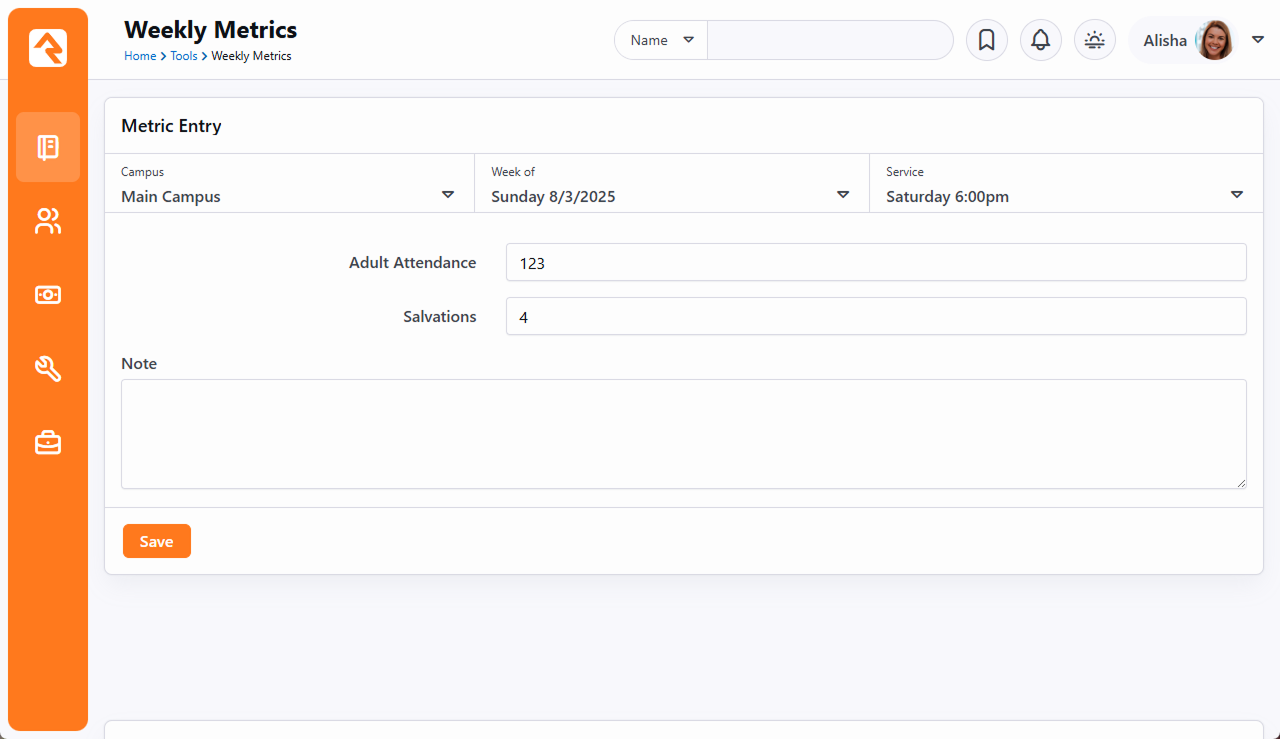
Pictured below, there are several block settings that allow you to configure the block,
the metrics you wish to enter and how the metric date should be determined. Please note that the image below is an Obsidian block.
Weekly Metrics Entry - Block Settings
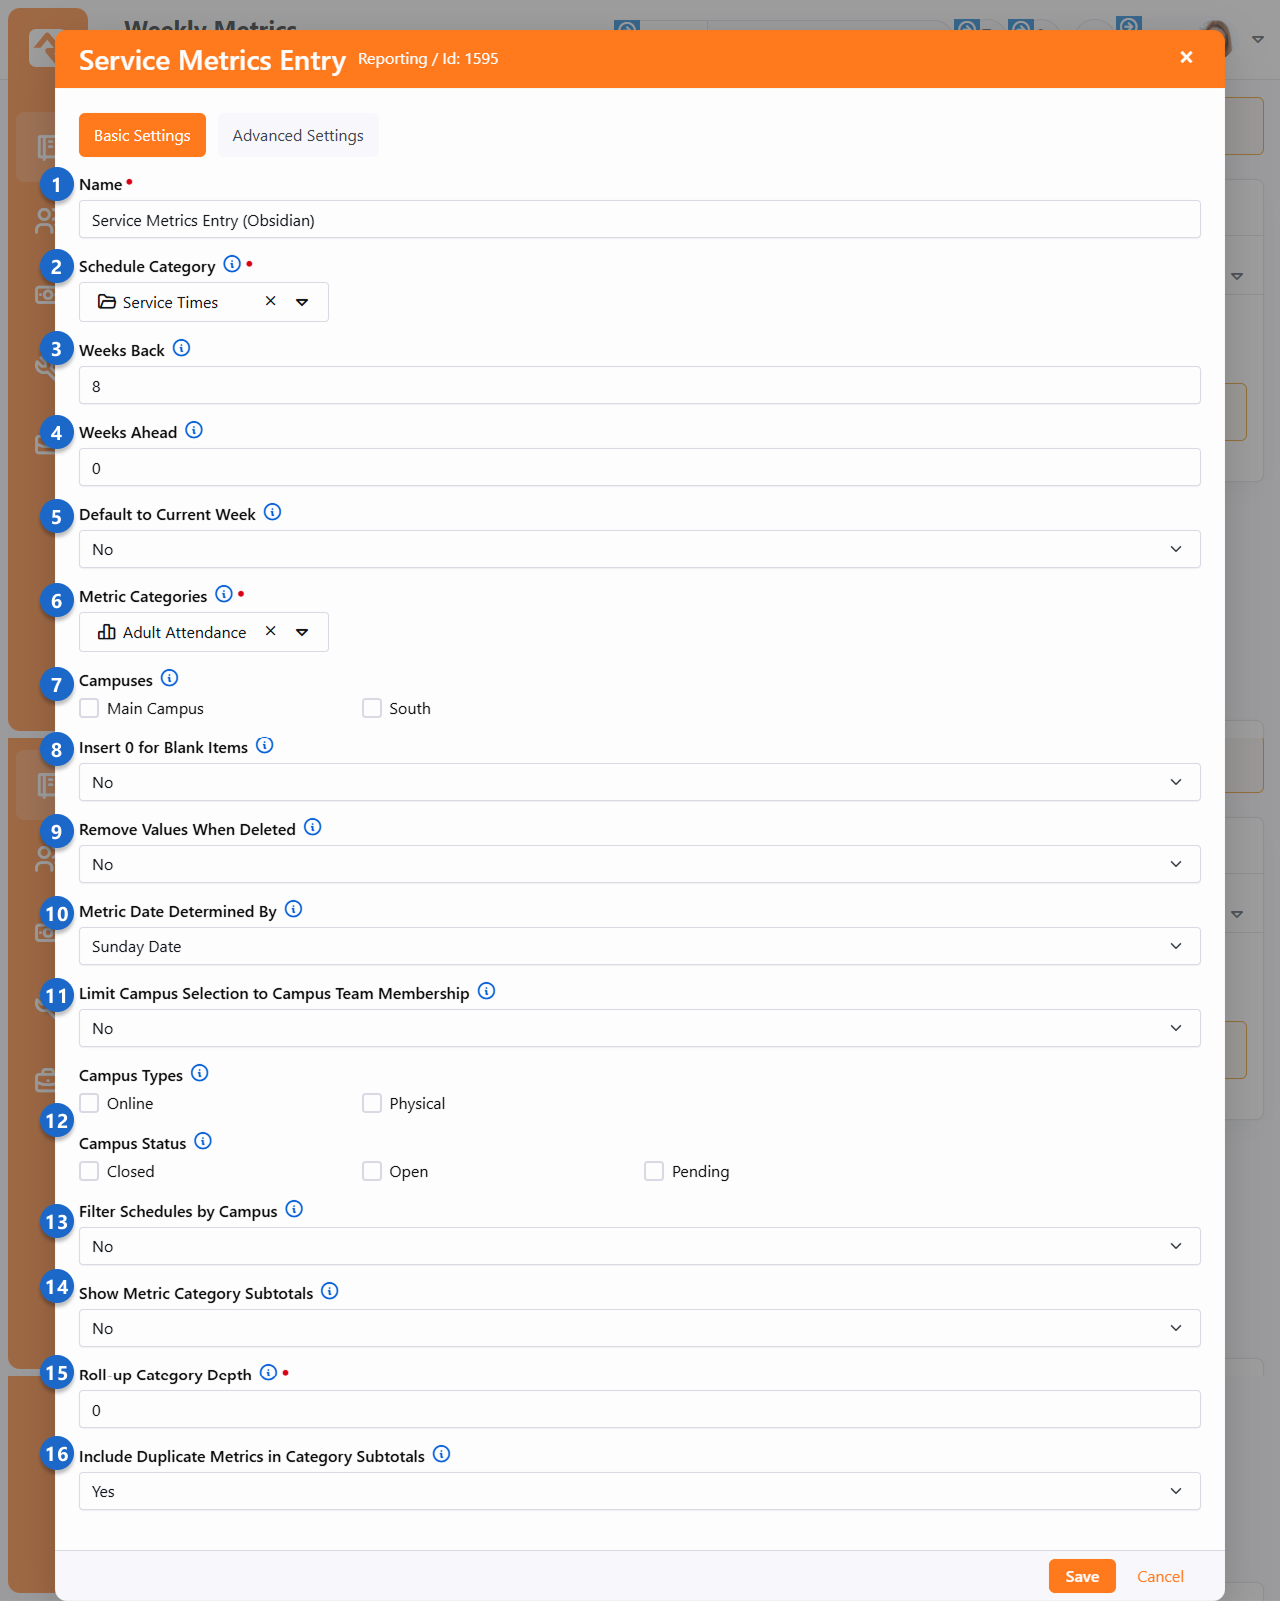
- 1 Name
- You probably won't need to change this, but if you want to customize the block's name
you can do so here.
- 2 Schedule Category
- This is where you'll identify the schedule category that has your service times.
- 3 Weeks Back
- For this block, you don't need to scroll through a list of every service you've
ever had. Still, it's likely you'll need to add metrics for services in the recent past.
This setting lets you control how far back, in weeks, you can enter service metrics.
- 4 Weeks Ahead
- Similar to the above setting, you can control how far ahead metrics can be entered
for a service. A value of zero, as shown in the screenshot, won't let you select any
services beyond the current week.
- 5 Default to Current Week
- When enabled, this block will bypass the step to select a week from a list and
will instead skip right to the entry page with the current week selected.
- 6 Metric Categories
- This setting determines which metrics will be entered on the page. In this example,
the weekly metrics of "Adult Attendance" and "Salvations" have been selected in the block's
settings, allowing fields for those metrics to appear on the page for data entry.
- 7 Campuses
- You can optionally limit this block to one or more campuses. If no campuses are selected,
then metrics can be entered for any campus.
- 8 Insert 0 for Blank Items
- When it comes to metrics, there can be a pretty big difference between a blank/empty
value and an actual zero. If this setting is enabled, any blank values will automatically
be replaced with a "0" by Rock when you save.
- 9 Remove Values When Deleted
- If enabled, metrics that already exist will be deleted if you remove the number from the entry page. This would result in a blank value, so the metric will not be deleted if you've enabled the Insert 0 for Blank Items option above.
- 10 Metric Date Determined By
- This setting determines what date to use when adding the metric.
'Sunday Date' will use the selected Sunday date from the page. 'Day from Schedule' will
use the first day that's configured from the schedule selected above. When using 'Day from Schedule'
remember that Sunday is the last day of the week.
- 11 Limit Campus Selection to Campus Team Membership
- If you have Campus Teams
set up then you can enable this setting to narrow down the list of campuses to only the ones
where the person is part of the Campus Team.
- 12 Campus Type and Status
- Selecting options here will limit the campuses available for entry according to their
Type and Status. For instance, you might only want to show
Physical campuses
that are Open.
- 13 Filter Schedules by Campus
- Enabling this will restrict the Schedules available to only those associated with the campus.
This only applies if you have
Campus Schedules
configured.
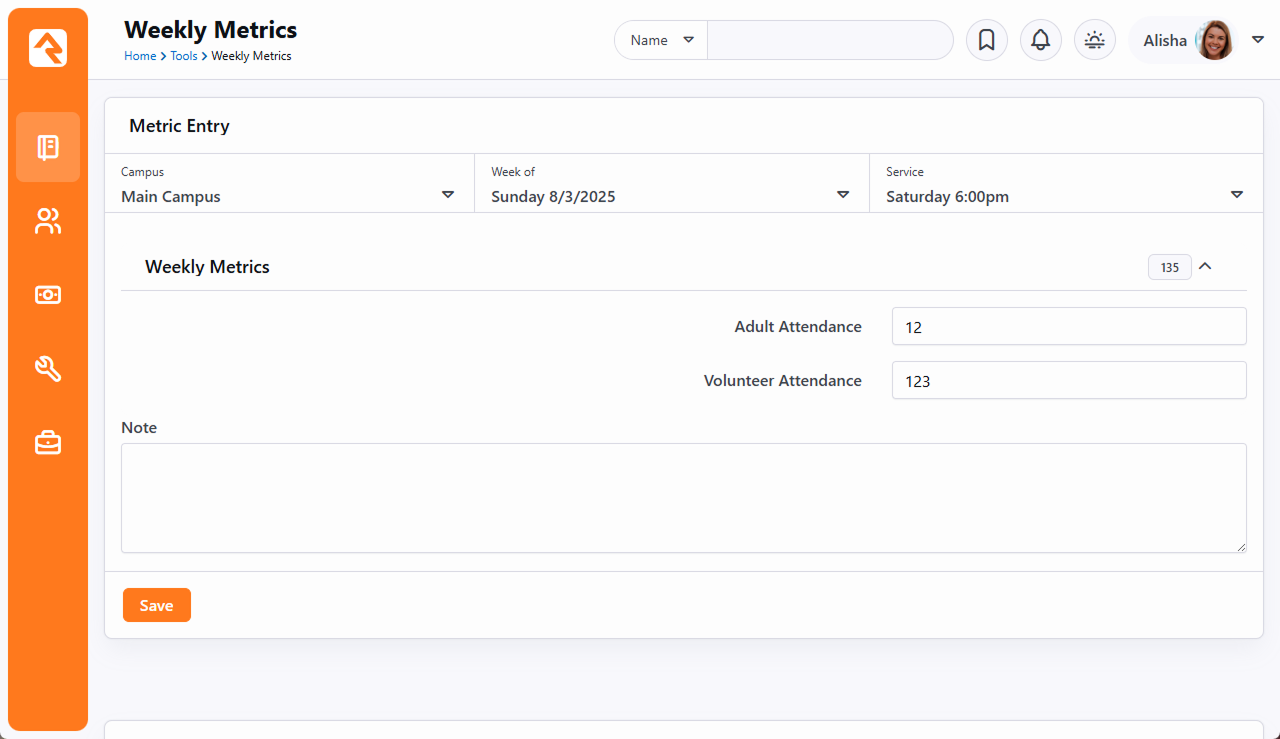
- 14 Show Metric Category Subtotals
- As pictured below, you can enable this to sum up metric values by category. Higher-level categories would provide a sum of the child categories beneath it.
- 15 Roll-up Category Depth
- This setting determines how far up in the category tree you should go (1 = parent, 2 = grandparent, etc.) when entering metrics..
- 16 Include Duplicate Metrics in Category Subtotals
- A single metric can be in more than one category. This setting determines if it should be counted more than once when it appears in multiple categories.
Below, you'll find an alternative view of the
Weekly Metrics page,
showcasing the activation of some of the optional block settings mentioned earlier.
Specifically, the options related to the metric categories.
Weekly Metrics Entry - Category Subtotals
Calculating Metrics
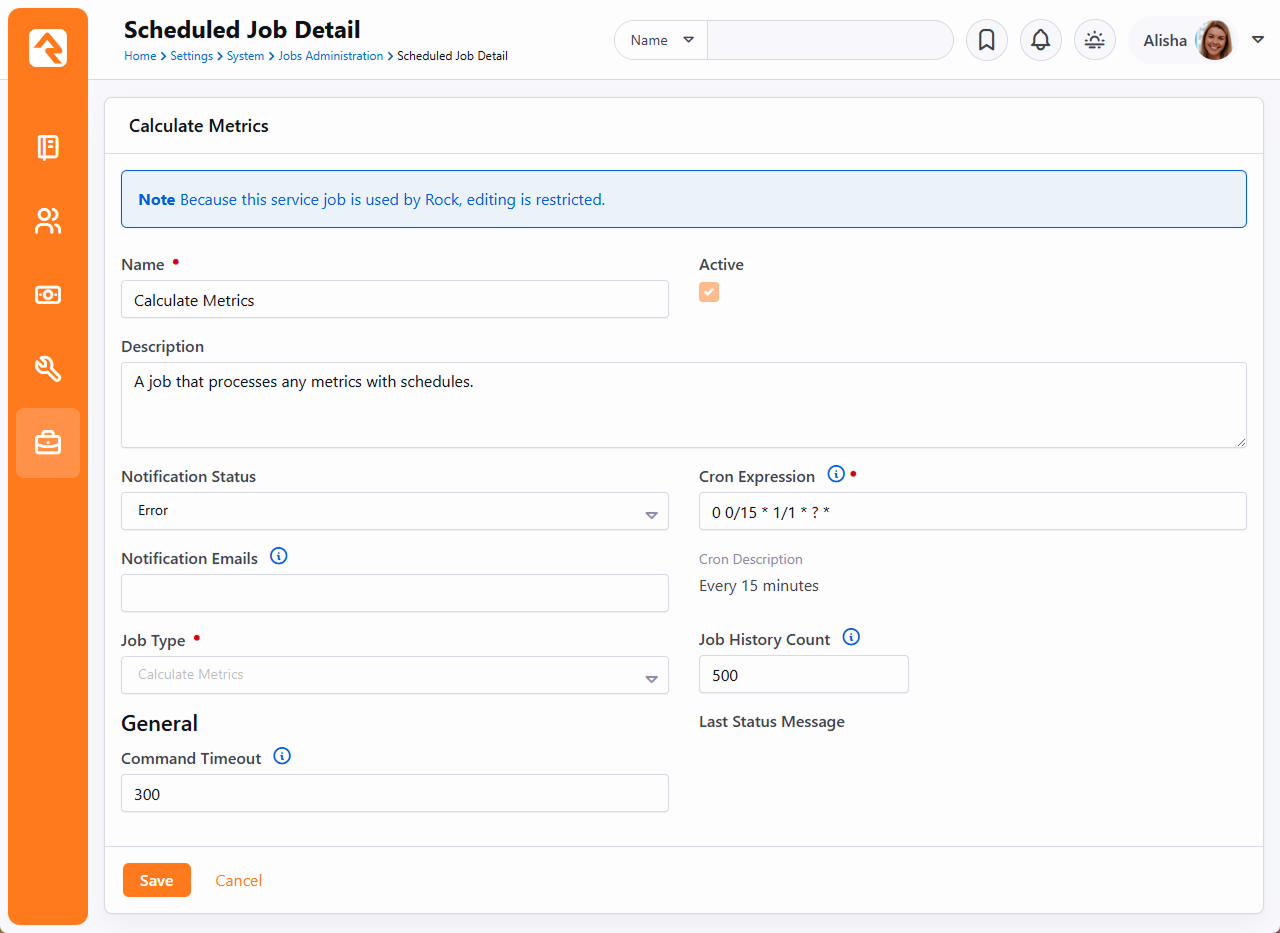
Metric values can be added using the methods described above. However, metrics that use a
Source Type
of SQL, Data View or Lava can be automatically calculated based on a schedule you provide when
editing or creating the metric. The calculations are performed when the
Calculate Metrics job is
run. As pictured below, this job runs once every 15 minutes to process any metrics that need
to be calculated based on their schedule. If you have a SQL metric that takes a long time to
process, you can adjust the
Command Timeout job
setting to allow the calculation to be completed.
Calculate Metrics Job
Metrics can also be calculated on demand, rather than waiting for the Calculate Metrics job
to calculate the metric based on its schedule. Simply click the
button pictured below to calculate any metric that uses SQL, Data View or Lava as its
Source Type. Manually
calculating a metric in this way will not disrupt the schedule on which it normally
calculates.
Calculate Metrics Run Now
Metrics Dashboards
We've seen that metrics provide a limited graphing capability for viewing their values.
What if you want to create enhanced dashboards for viewing your metrics? Rock ships with
several blocks to help you create rich dashboards based off of metrics.
Anatomy of a Dashboard
Dashboard Parts
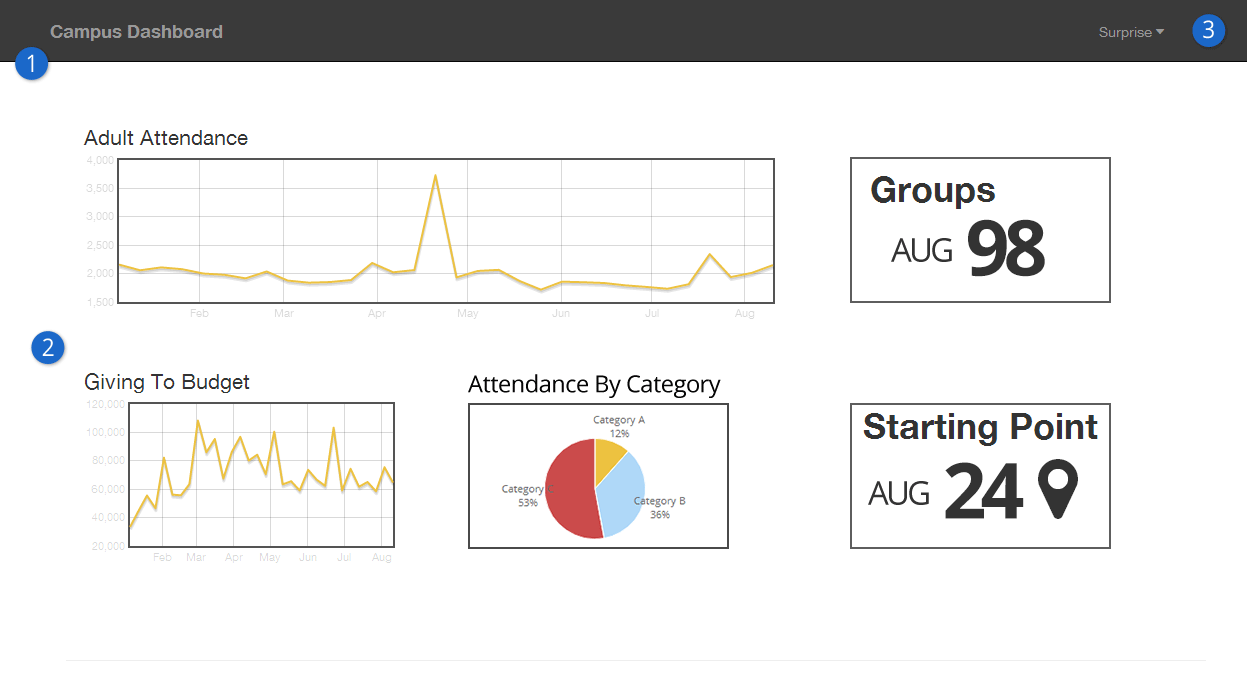
- 1Theme
- While dashboard blocks can be placed on any page in Rock, we do ship with a special
theme designed for dashboards called Dashboard Stark. This a very basic starter theme
for you to use as a starting point for creating your own. When you do create new
dashboard themes, we highly recommend you prefix their name with
Dashboard
to help keep them grouped together in lists.
- 2Dashboard Widgets
- The widgets are simply Rock blocks on the page. We discuss each type of block below
in detail.
- 3Context Setter
- While optional, a context setting on the page allows you to filter the metric
values by their Series Partition.
Many times, this is a campus selector or group selector.
Dashboard Blocks
Rock ships with several dashboard widget blocks. Each of these blocks is shown below.
Line Chart
Line Chart
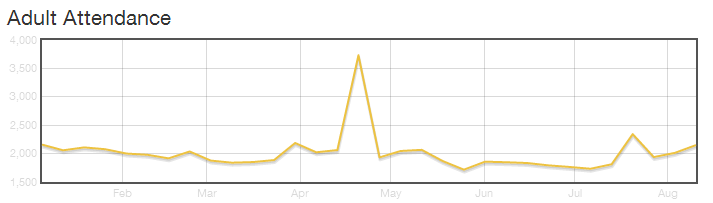
This block displays a line chart for the selected metric. Options include:
| Title |
Description |
| Name |
This is the block name. It is not displayed anywhere on the output of the block. |
| Title |
The title that is displayed for the metric. |
| Subtitle |
The subtitle for the metric. |
| Column Width |
The number of Bootstrap columns the chart should use for its width. (A Bootstrap row, by default, has 12 columns.) |
| Chart Style |
The chart style to use. These styles are defined under Admin Tools > Settings > Defined Types > Chart Styles. |
| Metric |
The metric to use for the chart. |
| Partition Filter |
Determines how the chart will get the series partition value. It can be either hard coded or determined from the page context. |
| Date Range |
Determines which values are displayed on the graph. |
| Detail Page |
This optional setting will determine which page will be loaded when the graph is clicked. |
Pie Chart
Pie Chart
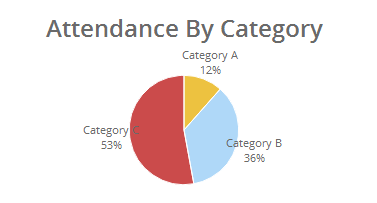
This block displays a pie chart for a given metric. Options include:
| Title |
Description |
| Name |
This is the block name. It is not displayed anywhere on the output of the block. |
| Title |
The title that is displayed for the metric. |
| Subtitle |
The subtitle for the metric. |
| Column Width |
The number of Bootstrap columns the chart should use for its width. (A Bootstrap row, by default, has 12 columns.) |
| Chart Style |
The chart style to use. These styles are defined under Admin Tools > Settings > Defined Types > Chart Styles. |
| Metric Value Type |
Determines what metric value types should be displayed on the chart, goals and/or measures. |
| Metrics |
The metrics to use for the chart. Each metric will represent one slice of the pie chart. |
| Date Range |
Determines which values are displayed on the graph. |
| Detail Page |
This optional setting will determine which page will be loaded when the graph is clicked. |
Lava Dashboard Widget
Lava Dashboard Widget
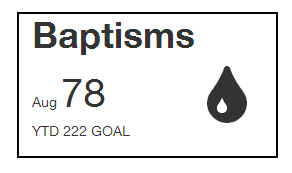
This block renders the metric values using a Lava template. Options include:
| Title |
Description |
| Name |
This is the block name. It is not displayed anywhere on the output of the block. |
| Title |
The title that is displayed for the metric. |
| Subtitle |
The subtitle for the metric. |
| Column Width |
The number of Bootstrap columns the chart should use for its width. (A Bootstrap row, by default, has 12 columns.) |
| Round Values |
Round Y values to the nearest whole number. For example, display 25.00 as 25. |
| Metric |
The metrics to use for the chart. |
| Lava Template |
The Lava template to render the output for display. |
See our Lava
documentation for more information.
Under Construction
Work is still being done on the metrics dashboard features. Expect changes that
may impact configuration settings. Feel free to play with these features but don't
roll them out in production just yet.
SQL Editor
While not technically a reporting tool, the SQL Editor page
(Admin Tools > SQL Editor)
allows you to execute a SQL statement right in the browser. This makes it possible for
administrators and developers to perform many tasks without requiring software like SQL Server
Management Studio.
Warning
Special Care should be taken with this tool, since it does permit UPDATES to your
database. Since it is possible to quickly wipe out swaths of data, access to this
page/block should be minimized to people with something to lose in return.
SQL Editor
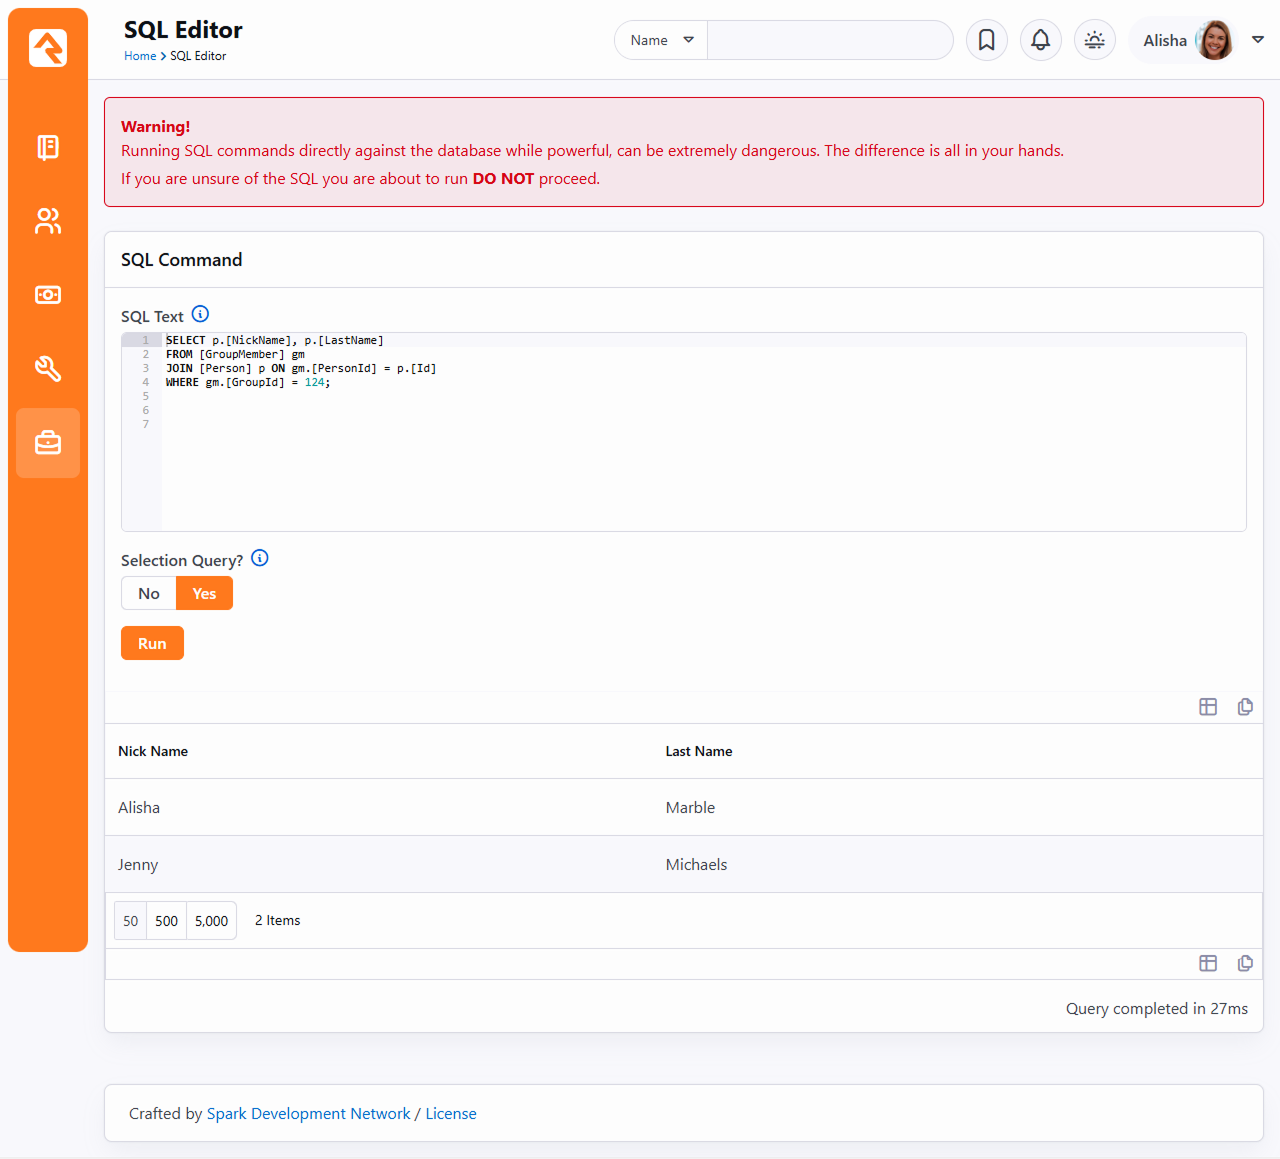
For additional details check out the
Rock Admin Hero Guide.
Business Intelligence
Rock's Business Intelligence features are so cool, they deserve
their own book!